Projects
Nagios Core - Performance Graphs Using InfluxDB + Nagflux + Grafana + Histou
IMPORTANT
DO NOT follow this guide if you are using Nagios XI. Nagios XI includes it's own performance graphing capabilities and following this guide will result in breaking your Nagios XI installation.
This documentation explains how to configure Nagios Core to use the programs InfluxDB, Nagflux, Grafana and Histou to generate performance graphs.
When Nagios Core receives check results from Host and Service checks, the check result can include performance data. This performance data needs to be specifically formatted as per the following guidelines:
Nagios Plugins Development Guidelines - Performance Data
Nagios Core does not have it's own performance data engine built in to process this performance data, instead it provides functionality to pass this performance data to an external program that can store that data for later analysis. This guide instructs you to implement the following functionality:
- InfluxDB
- Time series database that will be used to store the performance data
- Nagflux
- Cnnector which stores the performance data from Nagios into InfluxDB
- Grafana
- A web based analytics platform that allows you to visualise the performance data in InfluxDB
- Histou
- A Grafana add on that creates graphs specifically for the Nagios performance data
This guide is broken up into several sections and covers different Linux distributions and operating systems (OS). If your Linux Distribution or operating system is not included in this guide then please contact us to see if we can get it added. Some distributions may be missing as we don't have access to a test environment that allows us to develop the documentation.
Note: This guide is based on Nagios Core being installed using the following KB article:
Documentation - Installing Nagios Core From Source
Please select your OS:
CentOS | RHEL | Oracle Linux
This documentation works on CentOS / RHEL / Oracle Linux version 7+. We were unable to get this solution working on versions prior to 7.x.
Install InfluxDB
Please follow the InfluxDB installation documentation:
https://docs.influxdata.com/influxdb/v1.4/introduction/installation/
Once installed, execute the following commands to start the service and ensure it is enabled to start on boot:
systemctl enable influxdb.service
systemctl start influxdb.service
Install Nagflux
Execute these commands to install the Go programming language and the required prerequisite packages:
yum install -y golang golang-github-influxdb-influxdb-client golang-github-influxdb-influxdb-datastore git
Download and compile Nagflux with the following commands:
export GOPATH=$HOME/gorepo
mkdir $GOPATH
go get -v -u github.com/griesbacher/nagflux
go build github.com/griesbacher/nagflux
mkdir -p /opt/nagflux
cp $GOPATH/bin/nagflux /opt/nagflux/
mkdir -p /usr/local/nagios/var/spool/nagfluxperfdata
chown nagios:nagios /usr/local/nagios/var/spool/nagfluxperfdata
Once installed, execute the following commands to create the service and ensure it is enabled to start on boot (it will not be started at this point):
cp $GOPATH/src/github.com/griesbacher/nagflux/nagflux.service /usr/lib/systemd/system/
chmod +x /usr/lib/systemd/system/nagflux.service
systemctl daemon-reload
systemctl enable nagflux.service
Install Grafana
Please follow the Grafana installation documentation:
http://docs.grafana.org/installation/rpm/
Once installed, execute the following commands to start the service and ensure it is enabled to start on boot:
systemctl enable grafana-server.service
systemctl start grafana-server.service
You need to allow port 3000 inbound traffic on the local firewall so you can reach the Grafana web interface:
firewall-cmd --zone=public --add-port=3000/tcp
firewall-cmd --zone=public --add-port=3000/tcp --permanent
Install Histou
Execute these commands to install Histou:
cd /tmp
wget -O histou.tar.gz https://github.com/Griesbacher/histou/archive/v0.4.3.tar.gz
mkdir -p /var/www/html/histou
cd /var/www/html/histou
tar xzf /tmp/histou.tar.gz --strip-components 1
cp histou.ini.example histou.ini
cp histou.js /usr/share/grafana/public/dashboards/
Please proceed to the Nagflux Configuration section for the next step.
Ubuntu
This documentation works on Ubuntu version 16+. We were unable to get this solution working on versions prior to 16.x.
Prerequisites
Execute these commands to install some pre-requisite packages:
sudo apt-get update
sudo apt-get install -y curl apt-transport-https
Install InfluxDB
Please follow the InfluxDB installation documentation:
https://docs.influxdata.com/influxdb/v1.4/introduction/installation/
Once installed, execute the following commands to start the service and ensure it is enabled to start on boot:
sudo systemctl daemon-reload
sudo systemctl enable influxdb.service
sudo systemctl start influxdb.service
Install Nagflux
Execute these commands to install the Go programming language and the required prerequisite packages:
sudo apt-get install -y golang golang-github-influxdb-usage-client-dev git
Download and compile Nagflux with the following commands:
echo "export GOPATH=$HOME/gorepo" >> ~/.bashrc
source ~/.bashrc
mkdir $GOPATH
go get -v -u github.com/griesbacher/nagflux
go build github.com/griesbacher/nagflux
sudo mkdir -p /opt/nagflux
sudo cp $GOPATH/bin/nagflux /opt/nagflux/
sudo mkdir -p /usr/local/nagios/var/spool/nagfluxperfdata
sudo chown nagios:nagios /usr/local/nagios/var/spool/nagfluxperfdata
Once installed, execute the following commands to create the service and ensure it is enabled to start on boot (it will not be started at this point):
sudo cp $GOPATH/src/github.com/griesbacher/nagflux/nagflux.service /lib/systemd/system/
sudo chmod +x /lib/systemd/system/nagflux.service
sudo systemctl daemon-reload
sudo systemctl enable nagflux.service
Install Grafana
Please follow the Grafana installation documentation:
http://docs.grafana.org/installation/debian/
Once installed, execute the following commands to start the service and ensure it is enabled to start on boot:
sudo systemctl daemon-reload
sudo systemctl enable grafana-server.service
sudo systemctl start grafana-server.service
You need to allow port 3000 inbound traffic on the local firewall so you can reach the Grafana web interface.
sudo ufw allow 3000/tcp
sudo ufw reload
Install Histou
Execute these commands to install Histou:
cd /tmp
wget -O histou.tar.gz https://github.com/Griesbacher/histou/archive/v0.4.3.tar.gz
sudo mkdir -p /var/www/html/histou
cd /var/www/html/histou
sudo tar xzf /tmp/histou.tar.gz --strip-components 1
sudo cp histou.ini.example histou.ini
sudo cp histou.js /usr/share/grafana/public/dashboards/
Please proceed to the Nagflux Configuration section for the next step.
SUSE SLES | openSUSE Leap
This documentation was tested on openSUSE Leap 42.2.
Install InfluxDB
Please follow the InfluxDB installation documentation:
https://docs.influxdata.com/influxdb/v1.4/introduction/installation/
Once installed, execute the following commands to start the service and ensure it is enabled to start on boot:
sudo systemctl daemon-reload
sudo systemctl enable influxdb.service
sudo systemctl start influxdb.service
Install Nagflux
Execute these commands to install the Go programming language and the required prerequisite packages:
sudo zypper --non-interactive install go golang-github-influxdata-usage-client git
Download and compile Nagflux with the following commands:
echo "export GOPATH=$HOME/gorepo" >> ~/.bashrc
source ~/.bashrc
mkdir $GOPATH
go get -v -u github.com/griesbacher/nagflux
go build github.com/griesbacher/nagflux
sudo mkdir -p /opt/nagflux
sudo cp $GOPATH/bin/nagflux /opt/nagflux/
sudo mkdir -p /usr/local/nagios/var/spool/nagfluxperfdata
sudo chown nagios:nagios /usr/local/nagios/var/spool/nagfluxperfdata
Once installed, execute the following commands to create the service and ensure it is enabled to start on boot (it will not be started at this point):
sudo cp $GOPATH/src/github.com/griesbacher/nagflux/nagflux.service /usr/lib/systemd/system/
sudo chmod +x /usr/lib/systemd/system/nagflux.service
sudo systemctl daemon-reload
sudo systemctl enable nagflux.service
Install Grafana
Please follow the Grafana installation documentation:
http://docs.grafana.org/installation/rpm/
Once installed, execute the following commands to start the service and ensure it is enabled to start on boot:
sudo systemctl enable grafana-server.service
sudo systemctl start grafana-server.service
You need to allow port 3000 inbound traffic on the local firewall so you can reach the Grafana web interface:
===== SUSE SLES 12.x =====
sudo /usr/sbin/SuSEfirewall2 open EXT TCP 3000
sudo systemctl restart SuSEfirewall2
===== openSUSE Leap 42.x =====
The firewall service is not enabled by defauly on openSUSE.
Install Histou
Execute these commands to install Histou:
cd /tmp
wget -O histou.tar.gz https://github.com/Griesbacher/histou/archive/v0.4.3.tar.gz
sudo mkdir -p /srv/www/htdocs/histou
cd /srv/www/htdocs/histou
sudo tar xzf /tmp/histou.tar.gz --strip-components 1
sudo cp histou.ini.example histou.ini
sudo cp histou.js /usr/share/grafana/public/dashboards/
Please proceed to the Nagflux Configuration section for the next step.
Debian | Raspbian
This documentation works on Debian / Raspbian version 9+. We were unable to get this solution working on versions prior to 9.x.
All steps on Debian require to run as root. To become root simply run:
Debian:
su
Raspbian:
sudo -i
All commands from this point onwards will be as root.
Prerequisites
Execute these commands to install some pre-requisite packages:
apt-get update
apt-get install -y curl apt-transport-https
Install InfluxDB
Please follow the InfluxDB installation documentation:
https://docs.influxdata.com/influxdb/v1.4/introduction/installation/
Once installed, execute the following commands to start the service and ensure it is enabled to start on boot:
systemctl daemon-reload
systemctl enable influxdb.service
systemctl start influxdb.service
Install Nagflux
Execute these commands to install the Go programming language and the required prerequisite packages:
apt-get install -y golang golang-github-influxdb-usage-client-dev git
Download and compile Nagflux with the following commands:
export GOPATH=$HOME/gorepo
mkdir $GOPATH
go get -v -u github.com/griesbacher/nagflux
go build github.com/griesbacher/nagflux
mkdir -p /opt/nagflux
cp $GOPATH/bin/nagflux /opt/nagflux/
mkdir -p /usr/local/nagios/var/spool/nagfluxperfdata
chown nagios:nagios /usr/local/nagios/var/spool/nagfluxperfdata
Once installed, execute the following commands to create the service and ensure it is enabled to start on boot (it will not be started at this point):
cp $GOPATH/src/github.com/griesbacher/nagflux/nagflux.service /lib/systemd/system/
chmod +x /lib/systemd/system/nagflux.service
systemctl daemon-reload
systemctl enable nagflux.service
Install Grafana
Please follow the Grafana installation documentation:
http://docs.grafana.org/installation/debian/
Once installed, execute the following commands to start the service and ensure it is enabled to start on boot:
systemctl daemon-reload
systemctl enable grafana-server.service
systemctl start grafana-server.service
You need to allow port 3000 inbound traffic on the local firewall so you can reach the Grafana web interface.
iptables -I INPUT -p tcp --destination-port 3000 -j ACCEPT
Install Histou
Execute these commands to install Histou:
cd /tmp
wget -O histou.tar.gz https://github.com/Griesbacher/histou/archive/v0.4.3.tar.gz
mkdir -p /var/www/html/histou
cd /var/www/html/histou
tar xzf /tmp/histou.tar.gz --strip-components 1
cp histou.ini.example histou.ini
cp histou.js /usr/share/grafana/public/dashboards/
Please proceed to the Nagflux Configuration section for the next step.
Arch Linux
Install InfluxDB
Please follow these instructions to install InfluxDB from the Arch User Repository:
pacman --noconfirm -S go git asciidoc xmlto
su nagios
cd /tmp
wget https://aur.archlinux.org/cgit/aur.git/snapshot/influxdb.tar.gz
tar xzf influxdb.tar.gz
cd influxdb
makepkg
exit
pacman -U /tmp/influxdb/influxdb-1.4.3-1-x86_64.pkg.tar.xz
Once installed, execute the following commands to start the service and ensure it is enabled to start on boot:
systemctl enable influxdb.service
systemctl start influxdb.service
Install Nagflux
Download and compile Nagflux with the following commands:
cd /tmp
export GOPATH=$HOME/gorepo
mkdir $GOPATH
go get -v -u github.com/griesbacher/nagflux
go build github.com/griesbacher/nagflux
mkdir -p /opt/nagflux
cp $GOPATH/bin/nagflux /opt/nagflux/
mkdir -p /usr/local/nagios/var/spool/nagfluxperfdata
chown nagios:nagios /usr/local/nagios/var/spool/nagfluxperfdata
Once installed, execute the following commands to create the service and ensure it is enabled to start on boot (it will not be started at this point):
cp $GOPATH/src/github.com/griesbacher/nagflux/nagflux.service /usr/lib/systemd/system/
chmod +x /usr/lib/systemd/system/nagflux.service
systemctl daemon-reload
systemctl enable nagflux.service
Install Grafana
Please follow these instructions to install Grafana:
pacman --noconfirm -S grafana
Once installed, execute the following commands to start the service and ensure it is enabled to start on boot:
systemctl enable grafana.service
systemctl start grafana.service
Arch Linux does not have a firewall enabled in a fresh installation. Please refer to the Arch Linux documentation on allowing TCP port 3000 inbound.
Install Histou
Execute these commands to install Histou:
cd /tmp
wget -O histou.tar.gz https://github.com/Griesbacher/histou/archive/v0.4.3.tar.gz
mkdir -p /srv/http/histou
cd /srv/http/histou
tar xzf /tmp/histou.tar.gz --strip-components 1
cp histou.ini.example histou.ini
cp histou.js /usr/share/grafana/public/dashboards/
Please proceed to the Nagflux Configuration section for the next step.
Nagflux Configuration
The next step is to create the Nagflux config file /opt/nagflux/config.gcfg. The following is the configuration you are going to populate in the config.gcfg file:
[main]
    NagiosSpoolfileFolder = "/usr/local/nagios/var/spool/nagfluxperfdata"
    NagiosSpoolfileWorker = 1
    InfluxWorker = 2
    MaxInfluxWorker = 5
    DumpFile = "nagflux.dump"
    NagfluxSpoolfileFolder = "/usr/local/nagios/var/nagflux"
    FieldSeparator = "&"
    BufferSize = 10000
    FileBufferSize = 65536
    DefaultTarget = "all"

[Log]
    LogFile = ""
    MinSeverity = "INFO"

[InfluxDBGlobal]
    CreateDatabaseIfNotExists = true
    NastyString = ""
    NastyStringToReplace = ""
    HostcheckAlias = "hostcheck"

[InfluxDB "nagflux"]
    Enabled = true
    Version = 1.0
    Address = "http://127.0.0.1:8086"
    Arguments = "precision=ms&u=root&p=root&db=nagflux"
    StopPullingDataIfDown = true

[InfluxDB "fast"]
    Enabled = false
    Version = 1.0
    Address = "http://127.0.0.1:8086"
    Arguments = "precision=ms&u=root&p=root&db=fast"
    StopPullingDataIfDown = false
Create the file by executing the following commands:
CentOS / RHEL / Oracle Linux / Debian / Raspbian / Arch Linux / Gentoo
cd /opt/nagflux
printf '[main]\n' > config.gcfg
printf '\tNagiosSpoolfileFolder = "/usr/local/nagios/var/spool/nagfluxperfdata"\n' >> config.gcfg
printf '\tNagiosSpoolfileWorker = 1\n' >> config.gcfg
printf '\tInfluxWorker = 2\n' >> config.gcfg
printf '\tMaxInfluxWorker = 5\n' >> config.gcfg
printf '\tDumpFile = "nagflux.dump"\n' >> config.gcfg
printf '\tNagfluxSpoolfileFolder = "/usr/local/nagios/var/nagflux"\n' >> config.gcfg
printf '\tFieldSeparator = "&"\n' >> config.gcfg
printf '\tBufferSize = 10000\n' >> config.gcfg
printf '\tFileBufferSize = 65536\n' >> config.gcfg
printf '\tDefaultTarget = "all"\n' >> config.gcfg
printf '\n' >> config.gcfg
printf '[Log]\n' >> config.gcfg
printf '\tLogFile = ""\n' >> config.gcfg
printf '\tMinSeverity = "INFO"\n' >> config.gcfg
printf '\n' >> config.gcfg
printf '[InfluxDBGlobal]\n' >> config.gcfg
printf '\tCreateDatabaseIfNotExists = true\n' >> config.gcfg
printf '\tNastyString = ""\n' >> config.gcfg
printf '\tNastyStringToReplace = ""\n' >> config.gcfg
printf '\tHostcheckAlias = "hostcheck"\n' >> config.gcfg
printf '\n' >> config.gcfg
printf '[InfluxDB "nagflux"]\n' >> config.gcfg
printf '\tEnabled = true\n' >> config.gcfg
printf '\tVersion = 1.0\n' >> config.gcfg
printf '\tAddress = "http://127.0.0.1:8086"\n' >> config.gcfg
printf '\tArguments = "precision=ms&u=root&p=root&db=nagflux"\n' >> config.gcfg
printf '\tStopPullingDataIfDown = true\n' >> config.gcfg
printf '\n' >> config.gcfg
printf '[InfluxDB "fast"]\n' >> config.gcfg
printf '\tEnabled = false\n' >> config.gcfg
printf '\tVersion = 1.0\n' >> config.gcfg
printf '\tAddress = "http://127.0.0.1:8086"\n' >> config.gcfg
printf '\tArguments = "precision=ms&u=root&p=root&db=fast"\n' >> config.gcfg
printf '\tStopPullingDataIfDown = false\n' >> config.gcfg
Ubuntu / SLES / openSUSE
cd /opt/nagflux
sudo sh -c "printf '[main]\n' > config.gcfg"
sudo sh -c "printf '\tNagiosSpoolfileFolder = \"/usr/local/nagios/var/spool/nagfluxperfdata\"\n' >> config.gcfg"
sudo sh -c "printf '\tNagiosSpoolfileWorker = 1\n' >> config.gcfg"
sudo sh -c "printf '\tInfluxWorker = 2\n' >> config.gcfg"
sudo sh -c "printf '\tMaxInfluxWorker = 5\n' >> config.gcfg"
sudo sh -c "printf '\tDumpFile = \"nagflux.dump\"\n' >> config.gcfg"
sudo sh -c "printf '\tNagfluxSpoolfileFolder = \"/usr/local/nagios/var/nagflux\"\n' >> config.gcfg"
sudo sh -c "printf '\tFieldSeparator = \"&\"\n' >> config.gcfg"
sudo sh -c "printf '\tBufferSize = 10000\n' >> config.gcfg"
sudo sh -c "printf '\tFileBufferSize = 65536\n' >> config.gcfg"
sudo sh -c "printf '\tDefaultTarget = \"all\"\n' >> config.gcfg"
sudo sh -c "printf '\n' >> config.gcfg"
sudo sh -c "printf '[Log]\n' >> config.gcfg"
sudo sh -c "printf '\tLogFile = \"\"\n' >> config.gcfg"
sudo sh -c "printf '\tMinSeverity = \"INFO\"\n' >> config.gcfg"
sudo sh -c "printf '\n' >> config.gcfg"
sudo sh -c "printf '[InfluxDBGlobal]\n' >> config.gcfg"
sudo sh -c "printf '\tCreateDatabaseIfNotExists = true\n' >> config.gcfg"
sudo sh -c "printf '\tNastyString = \"\"\n' >> config.gcfg"
sudo sh -c "printf '\tNastyStringToReplace = \"\"\n' >> config.gcfg"
sudo sh -c "printf '\tHostcheckAlias = \"hostcheck\"\n' >> config.gcfg"
sudo sh -c "printf '\n' >> config.gcfg"
sudo sh -c "printf '[InfluxDB \"nagflux\"]\n' >> config.gcfg"
sudo sh -c "printf '\tEnabled = true\n' >> config.gcfg"
sudo sh -c "printf '\tVersion = 1.0\n' >> config.gcfg"
sudo sh -c "printf '\tAddress = \"http://127.0.0.1:8086\"\n' >> config.gcfg"
sudo sh -c "printf '\tArguments = \"precision=ms&u=root&p=root&db=nagflux\"\n' >> config.gcfg"
sudo sh -c "printf '\tStopPullingDataIfDown = true\n' >> config.gcfg"
sudo sh -c "printf '\n' >> config.gcfg"
sudo sh -c "printf '[InfluxDB \"fast\"]\n' >> config.gcfg"
sudo sh -c "printf '\tEnabled = false\n' >> config.gcfg"
sudo sh -c "printf '\tVersion = 1.0\n' >> config.gcfg"
sudo sh -c "printf '\tAddress = \"http://127.0.0.1:8086\"\n' >> config.gcfg"
sudo sh -c "printf '\tArguments = \"precision=ms&u=root&p=root&db=fast\"\n' >> config.gcfg"
sudo sh -c "printf '\tStopPullingDataIfDown = false\n' >> config.gcfg"
Now you need to start the nagflux service:
CentOS / RHEL / Oracle Linux / Debian / Raspbian / Arch Linux
systemctl start nagflux.service
Ubuntu / SLES / openSUSE
sudo systemctl start nagflux.service
Validate Nagflux to InfluxDB Configuration
When Nagflux starts for the first time it will create a nagflux database in InfluxDB. You can verify this was created by executing the following command:
curl -G "http://localhost:8086/query?pretty=true" --data-urlencode "q=show databases"
It should produce output like this:
{
    "results": [
        {
            "statement_id": 0,
            "series": [
                {
                    "name": "databases",
                    "columns": [
                        "name"
                    ],
                    "values": [
                        [
                            "_internal"
                        ],
                        [
                            "nagflux"
                        ]
                    ]
                }
            ]
        }
    ]
}
If the nagflux database appears in the list of databases then the Nagflux configuration is correct and InfluxDB is ready to receive performance data from Nagios.
Please proceed to the Nagios Command Configuration section for the next step.
Nagios Command Configuration
The next step is to configure Nagios to send performance data to Nagflux. This is done by adding a command definition to the Nagios configuration that will be used to process performance data.
Add the following command definition to your Nagios configuration. The location of your Nagios configuration files will depend on your Linux distribution:
CentOS / RHEL / Oracle Linux / Debian / Raspbian / Arch Linux / Gentoo
printf '\n# Nagflux command definition\n' >> /usr/local/nagios/etc/objects/commands.cfg
printf 'define command {\n' >> /usr/local/nagios/etc/objects/commands.cfg
printf '\tcommand_name\tprocess-service-perfdata\n' >> /usr/local/nagios/etc/objects/commands.cfg
printf '\tcommand_line\t/usr/bin/printf "%%b" "$LASTSERVICECHECK%%t$HOSTNAME%%t$SERVICEDESC%%t$SERVICESTATE%%t$SERVICEATTEMPT%%t$SERVICESTATETYPE%%t$SERVICEEXECUTIONTIME%%t$SERVICELATENCY%%t$SERVICEOUTPUT%%t$SERVICEPERFDATA\\n" >> /usr/local/nagios/var/spool/nagfluxperfdata/service-perfdata\n' >> /usr/local/nagios/etc/objects/commands.cfg
printf '}\n' >> /usr/local/nagios/etc/objects/commands.cfg
printf '\n' >> /usr/local/nagios/etc/objects/commands.cfg
printf 'define command {\n' >> /usr/local/nagios/etc/objects/commands.cfg
printf '\tcommand_name\tprocess-host-perfdata\n' >> /usr/local/nagios/etc/objects/commands.cfg
printf '\tcommand_line\t/usr/bin/printf "%%b" "$LASTHOSTCHECK%%t$HOSTNAME%%t$HOSTSTATE%%t$HOSTATTEMPT%%t$HOSTSTATETYPE%%t$HOSTEXECUTIONTIME%%t$HOSTLATENCY%%t$HOSTOUTPUT%%t$HOSTPERFDATA\\n" >> /usr/local/nagios/var/spool/nagfluxperfdata/host-perfdata\n' >> /usr/local/nagios/etc/objects/commands.cfg
printf '}\n' >> /usr/local/nagios/etc/objects/commands.cfg
Ubuntu / SLES / openSUSE
sudo sh -c "printf '\n# Nagflux command definition\n' >> /usr/local/nagios/etc/objects/commands.cfg"
sudo sh -c "printf 'define command {\n' >> /usr/local/nagios/etc/objects/commands.cfg"
sudo sh -c "printf '\tcommand_name\tprocess-service-perfdata\n' >> /usr/local/nagios/etc/objects/commands.cfg"
sudo sh -c "printf '\tcommand_line\t/usr/bin/printf \"%%b\" \"$LASTSERVICECHECK%%t$HOSTNAME%%t$SERVICEDESC%%t$SERVICESTATE%%t$SERVICEATTEMPT%%t$SERVICESTATETYPE%%t$SERVICEEXECUTIONTIME%%t$SERVICELATENCY%%t$SERVICEOUTPUT%%t$SERVICEPERFDATA\\n\" >> /usr/local/nagios/var/spool/nagfluxperfdata/service-perfdata\n' >> /usr/local/nagios/etc/objects/commands.cfg"
sudo sh -c "printf '}\n' >> /usr/local/nagios/etc/objects/commands.cfg"
sudo sh -c "printf '\n' >> /usr/local/nagios/etc/objects/commands.cfg"
sudo sh -c "printf 'define command {\n' >> /usr/local/nagios/etc/objects/commands.cfg"
sudo sh -c "printf '\tcommand_name\tprocess-host-perfdata\n' >> /usr/local/nagios/etc/objects/commands.cfg"
sudo sh -c "printf '\tcommand_line\t/usr/bin/printf \"%%b\" \"$LASTHOSTCHECK%%t$HOSTNAME%%t$HOSTSTATE%%t$HOSTATTEMPT%%t$HOSTSTATETYPE%%t$HOSTEXECUTIONTIME%%t$HOSTLATENCY%%t$HOSTOUTPUT%%t$HOSTPERFDATA\\n\" >> /usr/local/nagios/var/spool/nagfluxperfdata/host-perfdata\n' >> /usr/local/nagios/etc/objects/commands.cfg"
sudo sh -c "printf '}\n' >> /usr/local/nagios/etc/objects/commands.cfg"
Now you need to enable performance data processing in the Nagios main configuration file. Add or modify the following directives in your nagios.cfg file:
process_performance_data=1
service_perfdata_file=/usr/local/nagios/var/spool/nagfluxperfdata/service-perfdata
service_perfdata_file_template=DATATYPE::SERVICEPERFDATA\tTIMET::$LASTSERVICECHECK$\tHOSTNAME::$HOSTNAME$\tSERVICEDESC::$SERVICEDESC$\tSERVICESTATE::$SERVICESTATE$\tSERVICEATTEMPT::$SERVICEATTEMPT$\tSERVICESTATETYPE::$SERVICESTATETYPE$\tSERVICEEXECUTIONTIME::$SERVICEEXECUTIONTIME$\tSERVICELATENCY::$SERVICELATENCY$\tSERVICEOUTPUT::$SERVICEOUTPUT$\tSERVICEPERFDATA::$SERVICEPERFDATA$
service_perfdata_file_mode=a
service_perfdata_file_processing_interval=15
service_perfdata_file_processing_command=process-service-perfdata
host_perfdata_file=/usr/local/nagios/var/spool/nagfluxperfdata/host-perfdata
host_perfdata_file_template=DATATYPE::HOSTPERFDATA\tTIMET::$LASTHOSTCHECK$\tHOSTNAME::$HOSTNAME$\tHOSTSTATE::$HOSTSTATE$\tHOSTATTEMPT::$HOSTATTEMPT$\tHOSTSTATETYPE::$HOSTSTATETYPE$\tHOSTEXECUTIONTIME::$HOSTEXECUTIONTIME$\tHOSTLATENCY::$HOSTLATENCY$\tHOSTOUTPUT::$HOSTOUTPUT$\tHOSTPERFDATA::$HOSTPERFDATA$
host_perfdata_file_mode=a
host_perfdata_file_processing_interval=15
host_perfdata_file_processing_command=process-host-perfdata
After making these changes, restart Nagios to apply the new configuration:
CentOS / RHEL / Oracle Linux / Debian / Raspbian / Arch Linux
systemctl restart nagios.service
Ubuntu / SLES / openSUSE
sudo systemctl restart nagios.service
sed -i 's/^process_performance_data=0/process_performance_data=1/g' /usr/local/nagios/etc/nagios.cfg
sed -i 's/^#host_perfdata_file=/host_perfdata_file=/g' /usr/local/nagios/etc/nagios.cfg
sed -i 's/^#host_perfdata_file_template=.*/host_perfdata_file_template=DATATYPE::HOSTPERFDATA\\tTIMET::$TIMET$\\tHOSTNAME::$HOSTNAME$\\tHOSTPERFDATA::$HOSTPERFDATA$\\tHOSTCHECKCOMMAND::$HOSTCHECKCOMMAND$/g' /usr/local/nagios/etc/nagios.cfg
sed -i 's/^#host_perfdata_file_mode=/host_perfdata_file_mode=/g' /usr/local/nagios/etc/nagios.cfg
sed -i 's/^#host_perfdata_file_processing_interval=.*/host_perfdata_file_processing_interval=15/g' /usr/local/nagios/etc/nagios.cfg
sed -i 's/^#host_perfdata_file_processing_command=.*/host_perfdata_file_processing_command=process-host-perfdata-file-nagflux/g' /usr/local/nagios/etc/nagios.cfg
sed -i 's/^#service_perfdata_file=/service_perfdata_file=/g' /usr/local/nagios/etc/nagios.cfg
sed -i 's/^#service_perfdata_file_template=.*/service_perfdata_file_template=DATATYPE::SERVICEPERFDATA\\tTIMET::$TIMET$\\tHOSTNAME::$HOSTNAME$\\tSERVICEDESC::$SERVICEDESC$\\tSERVICEPERFDATA::$SERVICEPERFDATA$\\tSERVICECHECKCOMMAND::$SERVICECHECKCOMMAND$/g' /usr/local/nagios/etc/nagios.cfg
sed -i 's/^#service_perfdata_file_mode=/service_perfdata_file_mode=/g' /usr/local/nagios/etc/nagios.cfg
sed -i 's/^#service_perfdata_file_processing_interval=.*/service_perfdata_file_processing_interval=15/g' /usr/local/nagios/etc/nagios.cfg
sed -i 's/^#service_perfdata_file_processing_command=.*/service_perfdata_file_processing_command=process-service-perfdata-file-nagflux/g' /usr/local/nagios/etc/nagios.cfg
Two nagios commands need to be defined, it is recommended to place these in the /usr/local/nagios/etc/objects/commands.cfg file:
define command {
    command_name    process-host-perfdata-file-nagflux
    command_line    /bin/mv /usr/local/nagios/var/host-perfdata /usr/local/nagios/var/spool/nagfluxperfdata/$TIMET$.perfdata.host
}
define command {
    command_name    process-service-perfdata-file-nagflux
    command_line    /bin/mv /usr/local/nagios/var/service-perfdata /usr/local/nagios/var/spool/nagfluxperfdata/$TIMET$.perfdata.service
}
To make the required changes above you can manually edit the file, or the following commands will add those commands for you:
CentOS / RHEL / Oracle Linux / Debian / Raspbian / Arch Linux
echo '' >> /usr/local/nagios/etc/objects/commands.cfg
echo 'define command {' >> /usr/local/nagios/etc/objects/commands.cfg
echo '    command_name    process-host-perfdata-file-nagflux' >> /usr/local/nagios/etc/objects/commands.cfg
echo '    command_line    /bin/mv /usr/local/nagios/var/host-perfdata /usr/local/nagios/var/spool/nagfluxperfdata/$TIMET$.perfdata.host' >> /usr/local/nagios/etc/objects/commands.cfg
echo '    }' >> /usr/local/nagios/etc/objects/commands.cfg
echo '' >> /usr/local/nagios/etc/objects/commands.cfg
echo 'define command {' >> /usr/local/nagios/etc/objects/commands.cfg
echo '    command_name    process-service-perfdata-file-nagflux' >> /usr/local/nagios/etc/objects/commands.cfg
echo '    command_line    /bin/mv /usr/local/nagios/var/service-perfdata /usr/local/nagios/var/spool/nagfluxperfdata/$TIMET$.perfdata.service' >> /usr/local/nagios/etc/objects/commands.cfg
echo '    }' >> /usr/local/nagios/etc/objects/commands.cfg
echo '' >> /usr/local/nagios/etc/objects/commands.cfg
Ubuntu / SLES / openSUSE
sudo sh -c "echo '' >> /usr/local/nagios/etc/objects/commands.cfg"
sudo sh -c "echo 'define command {' >> /usr/local/nagios/etc/objects/commands.cfg"
sudo sh -c "echo '    command_name    process-host-perfdata-file-nagflux' >> /usr/local/nagios/etc/objects/commands.cfg"
sudo sh -c "echo '    command_line    /bin/mv /usr/local/nagios/var/host-perfdata /usr/local/nagios/var/spool/nagfluxperfdata/\$TIMET\$.perfdata.host' >> /usr/local/nagios/etc/objects/commands.cfg"
sudo sh -c "echo '    }' >> /usr/local/nagios/etc/objects/commands.cfg"
sudo sh -c "echo '' >> /usr/local/nagios/etc/objects/commands.cfg"
sudo sh -c "echo 'define command {' >> /usr/local/nagios/etc/objects/commands.cfg"
sudo sh -c "echo '    command_name    process-service-perfdata-file-nagflux' >> /usr/local/nagios/etc/objects/commands.cfg"
sudo sh -c "echo '    command_line    /bin/mv /usr/local/nagios/var/service-perfdata /usr/local/nagios/var/spool/nagfluxperfdata/\$TIMET\$.perfdata.service' >> /usr/local/nagios/etc/objects/commands.cfg"
sudo sh -c "echo '    }' >> /usr/local/nagios/etc/objects/commands.cfg"
sudo sh -c "echo '' >> /usr/local/nagios/etc/objects/commands.cfg"
Once those changes have been performed you will need to verify the Nagios Core configuration with the following command:
CentOS / RHEL / Oracle Linux / Debian / Raspbian / Arch Linux
/usr/local/nagios/bin/nagios -v /usr/local/nagios/etc/nagios.cfg
Ubuntu / SLES / openSUSE
sudo /usr/local/nagios/bin/nagios -v /usr/local/nagios/etc/nagios.cfg
If the verification was successful then you can restart the nagios service:
CentOS / RHEL / Oracle Linux / Debian / Raspbian / Arch Linux
systemctl restart nagios.service
Ubuntu / SLES / openSUSE
sudo systemctl restart nagios.service
The next step is to verify that Nagflux is working.
Verify Nagflux Is Working
Execute the following query to verify that InfluxDB is being populated with Nagios performance data:
curl -G "http://localhost:8086/query?db=nagflux&pretty=true" --data-urlencode "q=show series"
It should produce output like this:
{
    "results": [
        {
            "statement_id": 0,
            "series": [
                {
                    "columns": [
                        "key"
                    ],
                    "values": [
                        [
                            "metrics,command=check-host-alive,crit-fill=none,host=localhost,performanceLabel=pl,service=hostcheck,unit=%,warn-fill=none"
                        ],
                        [
                            "metrics,command=check-host-alive,crit-fill=none,host=localhost,performanceLabel=rta,service=hostcheck,unit=ms,warn-fill=none"
                        ],
                        [
                            "metrics,command=check_http,host=localhost,performanceLabel=size,service=HTTP,unit=B"
                        ],
                        [
                            "metrics,command=check_http,host=localhost,performanceLabel=time,service=HTTP,unit=s"
                        ],
                        [
                            "metrics,command=check_local_disk,crit-fill=none,host=localhost,performanceLabel=/,service=Root\ Partition,unit=MB,warn-fill=none"
                        ],
                        [
                            "metrics,command=check_local_load,crit-fill=none,host=localhost,performanceLabel=load1,service=Current\ Load,warn-fill=none"
                        ],
                        [
                            "metrics,command=check_local_load,crit-fill=none,host=localhost,performanceLabel=load15,service=Current\ Load,warn-fill=none"
                        ],
                        [
                            "metrics,command=check_local_load,crit-fill=none,host=localhost,performanceLabel=load5,service=Current\ Load,warn-fill=none"
                        ],
                        [
                            "metrics,command=check_local_procs,crit-fill=none,host=localhost,performanceLabel=procs,service=Total\ Processes,warn-fill=none"
                        ],
                        [
                            "metrics,command=check_local_swap,crit-fill=none,host=localhost,performanceLabel=swap,service=Swap\ Usage,unit=MB,warn-fill=none"
                        ],
                        [
                            "metrics,command=check_local_users,crit-fill=none,host=localhost,performanceLabel=users,service=Current\ Users,warn-fill=none"
                        ],
                        [
                            "metrics,command=check_ping,crit-fill=none,host=localhost,performanceLabel=pl,service=PING,unit=%,warn-fill=none"
                        ],
                        [
                            "metrics,command=check_ping,crit-fill=none,host=localhost,performanceLabel=rta,service=PING,unit=ms,warn-fill=none"
                        ],
                        [
                            "metrics,command=check_ssh,host=localhost,performanceLabel=time,service=SSH,unit=s"
                        ]
                    ]
                }
            ]
        }
    ]
}
In the output above, the metrics,command= shows the different performance data received by Nagios. If you are seeing information like this then everything is working as expected.
The next step is to configure Grafana.
Grafana Configuration
Now that Nagios is configured to send performance data to Nagflux, we need to configure Grafana to display this data. First, we need to create a data source in Grafana that connects to InfluxDB.
- Open your web browser and navigate to your Grafana instance (typically at
http://your-server:3000). - Log in with the default credentials (admin/admin) and change the password when prompted.
- Click on the gear icon in the left sidebar and select "Data Sources".
- Click "Add data source" and select "InfluxDB".
- Configure the data source with the following settings:
- Name:
Nagios - URL:
http://localhost:8086 - Database:
nagflux - User:
nagflux - Password:
nagflux - HTTP Method:
GET - Click "Save & Test"
- Name:
Now we need to import the Histou dashboard template. Histou provides a pre-configured dashboard that works well with Nagios performance data.
-
Download the Histou dashboard template:
wget https://raw.githubusercontent.com/Griesbacher/nagflux/master/histou/template.json -
In Grafana, click on the "+" icon in the left sidebar and select "Import".
-
Click "Upload JSON file" and select the
template.jsonfile you just downloaded. -
Select the "Nagios" data source you created earlier.
-
Click "Import".
The dashboard should now be available and displaying your Nagios performance data. You can customize the dashboard further by clicking on the panel title and selecting "Edit".
Please proceed to the Troubleshooting section if you encounter any issues.
Verify Histou Is Working
Histou returns data to Grafana so it can be visualised. The following example is going to use the Nagios PING service for the localhost (these are part of the default Nagios configurations). These values are expressed as host=localhost&service=PING in the following commands.
Execute the following query to verify that data can be retrieved:
curl -G "http://localhost/histou/?host=localhost&service=PING"
This will return a LOT of data, this confirms Histou is working.
To see Histou working in Grafana you use the following URL in the format of:
http://nagios_server:3000/dashboard/script/histou.js?host=host_object&service=service_object
Where
nagios_server= The DNS record or IP address of the nagios server3000= The port that Grafana is listening to requestshost_object= The name of the Nagios host object you want to display the graphs forservice_object= The name of the Nagios service object you want to display the graphs for
For example:
http://core-015.box293.local:3000/dashboard/script/histou.js?host=localhost&service=PING
This will return a graph similar to:
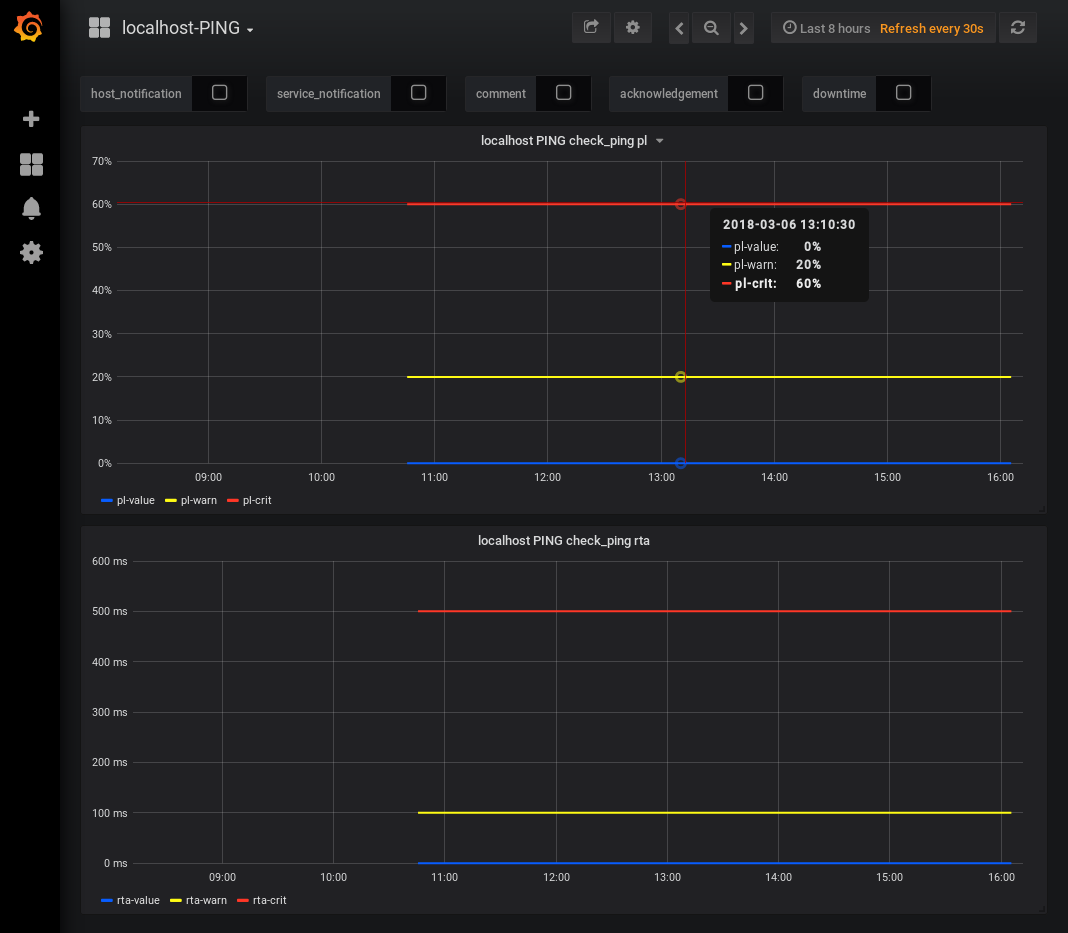
If your see a page similar to above then you have correctly configured Histou.
The next step is to configure Nagios Core web interface integration.
Nagios Core Web Interface Integration
Grafana / Histou can also be integrated into the Nagios Core web interface, this is quite useful however it does require some changes to your Nagios object definitions.
Nagios Core uses the action_url directive in object definitions to provide an icon/link when viewing host or service objects in the web interface.
This means that every object in Nagios Core requires the action_url directive to be defined. This can be easily achieved by using a template and using that template in your object definitions.
In a fresh installation of Nagios Core the following host and service templates need to be added to /usr/local/nagios/etc/objects/templates.cfg file:
define host {
   name       host-grafana
   action_url http://nagios_server:3000/dashboard/script/histou.js?host=$HOSTNAME$
   register   0
}

define service {
   name       service-grafana
   action_url http://nagios_server:3000/dashboard/script/histou.js?host=$HOSTNAME$&service=$SERVICEDESC$
   register   0
}
Replace nagios_server with the DNS record or ip address of your Nagios Core server.
To make the required changes above you can manually edit the file, or the following commands will add those templates for you:
CentOS / RHEL / Oracle Linux / Debian / Raspbian / Arch Linux
echo '' >> /usr/local/nagios/etc/objects/templates.cfg
echo 'define host {' >> /usr/local/nagios/etc/objects/templates.cfg
echo '   name       host-grafana' >> /usr/local/nagios/etc/objects/templates.cfg
echo '   action_url http://nagios_server:3000/dashboard/script/histou.js?host=$HOSTNAME$' >> /usr/local/nagios/etc/objects/templates.cfg
echo '   register   0' >> /usr/local/nagios/etc/objects/templates.cfg
echo '}' >> /usr/local/nagios/etc/objects/templates.cfg
echo '' >> /usr/local/nagios/etc/objects/templates.cfg
echo 'define service {' >> /usr/local/nagios/etc/objects/templates.cfg
echo '   name       service-grafana' >> /usr/local/nagios/etc/objects/templates.cfg
echo '   action_url http://nagios_server:3000/dashboard/script/histou.js?host=$HOSTNAME$&service=$SERVICEDESC$' >> /usr/local/nagios/etc/objects/templates.cfg
echo '   register   0' >> /usr/local/nagios/etc/objects/templates.cfg
echo '}' >> /usr/local/nagios/etc/objects/templates.cfg
echo '' >> /usr/local/nagios/etc/objects/templates.cfg
Ubuntu / SLES / openSUSE
sudo sh -c "echo '' >> /usr/local/nagios/etc/objects/templates.cfg"
sudo sh -c "echo 'define host {' >> /usr/local/nagios/etc/objects/templates.cfg"
sudo sh -c "echo '   name       host-grafana' >> /usr/local/nagios/etc/objects/templates.cfg"
sudo sh -c "echo '   action_url http://nagios_server:3000/dashboard/script/histou.js?host=$HOSTNAME$' >> /usr/local/nagios/etc/objects/templates.cfg"
sudo sh -c "echo '   register   0' >> /usr/local/nagios/etc/objects/templates.cfg"
sudo sh -c "echo '}' >> /usr/local/nagios/etc/objects/templates.cfg"
sudo sh -c "echo '' >> /usr/local/nagios/etc/objects/templates.cfg"
sudo sh -c "echo 'define service {' >> /usr/local/nagios/etc/objects/templates.cfg"
sudo sh -c "echo '   name       service-grafana' >> /usr/local/nagios/etc/objects/templates.cfg"
sudo sh -c "echo '   action_url http://nagios_server:3000/dashboard/script/histou.js?host=$HOSTNAME$&service=$SERVICEDESC$' >> /usr/local/nagios/etc/objects/templates.cfg"
sudo sh -c "echo '   register   0' >> /usr/local/nagios/etc/objects/templates.cfg"
sudo sh -c "echo '}' >> /usr/local/nagios/etc/objects/templates.cfg"
sudo sh -c "echo '' >> /usr/local/nagios/etc/objects/templates.cfg"
Then to use those templates you need to include them in your host and service directives. This example will update the generic-host and generic-service templates to include these templates, here is how they should look:
define host{
        name                            generic-host    ; The name of this host template
        use                               host-grafana

define service{
        name                            generic-service         ; The 'name' of this service template
        use                               service-grafana
In the example above the remaining options in the default templates have been omitted, there is no point showing all of those entries.
To make the required changes above you can manually edit the file, or the following commands will update those templates for you:
CentOS / RHEL / Oracle Linux / Debian / Raspbian / Arch Linux
sed -i '/name.*generic-host/a\        use                             host-grafana' /usr/local/nagios/etc/objects/templates.cfg
sed -i '/name.*generic-service/a\        use                             service-grafana' /usr/local/nagios/etc/objects/templates.cfg
Ubuntu / SLES / openSUSE
sudo sh -c "sed -i '/name.*generic-host/a\        use                             host-grafana' /usr/local/nagios/etc/objects/templates.cfg"
sudo sh -c "sed -i '/name.*generic-service/a\        use                             service-grafana' /usr/local/nagios/etc/objects/templates.cfg"
Once those changes have been performed you will need to verify the Nagios Core configuration with the following command:
CentOS / RHEL / Oracle Linux / Debian / Raspbian / Arch Linux
/usr/local/nagios/bin/nagios -v /usr/local/nagios/etc/nagios.cfg
Ubuntu / SLES / openSUSE
sudo /usr/local/nagios/bin/nagios -v /usr/local/nagios/etc/nagios.cfg
If the verification was successful then you can restart the nagios service:
CentOS / RHEL / Oracle Linux / Debian / Raspbian / Arch Linux
systemctl restart nagios.service
Ubuntu / SLES / openSUSE
sudo systemctl restart nagios.service
Finally open the Nagios Core web interface and navigate to the Services page, you should now see a graph icon for all the hosts and services. Clicking on an icon will open the host or service graph for that object in the Grafana web interface.
This completes the steps required for integrating InfluxDB, Nagflux, Grafana and Histou with Nagios Core.
Additional Reading
To get the most out of Grafana and Histou you should check out the documentation:
http://docs.grafana.org/guides/getting_started/ https://github.com/Griesbacher/histou
Final Thoughts
For any support related questions please visit the Nagios Support Forums at: