Library

Docs
Beta

Products

Adding MATCH Statements in the SNMP Trap InterfaceAutomatic Agent DeploymentAutomatic Nagios Core Migration to Nagios XIHow To Add A New User In Nagios XIHow To Configure Contact Groups in Nagios XIHow To Customize Your Dashboards With Dashlets In Nagios XIHow To Install Nagios XI via SourceHow To Manage MIBs In Nagios XIHow To Monitor A Gateway Switch With Nagios XIHow To Monitor A System Using SSHHow To Monitor DNS Servers and Queries with Nagios XIHow To Monitor Printers with Nagios XIHow To Monitor Security Cameras using Nagios XIHow To Monitor Websites with Nagios XIHow To Monitor Windows Machines With NCPA In Nagios XIHow To Monitor Windows Using SNMP In Nagios XIHow To Monitor Windows Using WinRMHow To Monitor your Mac OS/X devices using Nagios XIHow To Perform Nagios XI Landing Page CustomizationHow To Repair Crashed DatabasesHow To Select The Right Nagios XI Download For Your EnvironmentHow To Use Capacity PlanningHow To Use Scheduled ReportsHow To View The Latest Alerts In Nagios XIHow To configure Email Notifications in Nagios XIHow To configure Nagios XI to support Multi TenancyHow To configure your Timezone in Nagios XIHow To evaluate Nagios XI using -Hyper VHow To install Nagios XI in AWSHow To install Nagios XI using ESXiHow To install Nagios XI using Hyper VHow To install Nagios XI using VMware WorkstationHow To install Nagios XI using VMwareHow To install additional Configuration Wizards in Nagios XIHow To integrate Slack with Nagios XI 2024How To transfer Nagios XI from CentOS 7 to CentOS 9How To understand Users and Contacts in Nagios XIHow To update/upgrade Nagios XIHow To use Auto Discovery to setup host and service checks in XIHow To use Bulk Host Cloning and the Import WizardHow To use Business Process Intelligence (BPI)How To use Dashboards in Nagios XIHow To use Hypermap in Nagios XIHow To use Minemap MonitoringHow To use Nagios XI to Monitor Active DirectoryHow To use Tactical Overview in Nagios XIHow To utilize Reports and Graphs in Nagios XIHow To utilize Standard Edition (SE) ReportsHow to Agentless Monitor a Windows Machine with Nagios XIHow to Configure Contacts in Nagios XIHow to Use Custom Includes Component in Nagios XIInstalling on Non Standard SystemsManaging Contact TemplatesManaging Host TemplatesManaging Service TemplatesMigrating Nagios XI to a different ServerMonitoring Amazon EC2Monitoring Linux using NCPAMonitoring Office 365 Subscription ServicesMonitoring WebLogic on WindowsMonitoring Windows using NCPANagios Integrating MNTOSNagios XI 10,000 Services and growing NWC14Nagios XI API’s NWC13Nagios XI Accessing And Utilizing The Core Config ManagerNagios XI Activating Your LicenseNagios XI Add NagVis Map To A ViewNagios XI Adding And Removing A Host Using The APINagios XI Adding And Removing A Service Using The APINagios XI Adding Services To Pre existing Switch or RouterNagios XI Adding Windows Disk Usage Checks In XINagios XI Admin TourNagios XI Administrative User AccountsNagios XI Administrator GuideNagios XI Advanced Features of Nagios XI NWC14Nagios XI Ansible TutorialNagios XI Architecture OverviewNagios XI Audit LogNagios XI Automated Host Management In Nagios XINagios XI BPI XML CacheNagios XI Backend APINagios XI Backing Up And Restoring Your Nagios XI SystemNagios XI Backup and Restore OptionsNagios XI Bandwidth Graphs Showing 0Mb/s in Non English SystemsNagios XI Best Practices NWC15Nagios XI Best Practices for Managing ConfigsNagios XI Business Process IntegrationNagios XI Changing Host Alive CheckNagios XI Changing The Check Interval Of A ServiceNagios XI Changing The System TimeNagios XI Check Interval ConsiderationsNagios XI Checking Program Loadtime With autoIT in Nagios XINagios XI Cleaner Cron ArchitecureNagios XI Cloning UsersNagios XI Command Subsystem ArchitectureNagios XI Configuration Wizards and TemplatesNagios XI Configure PHP Development EnvironmentNagios XI Configuring Core Contacts to Use XI’s phpmailer SMTP SettingsNagios XI Configuring DowntimeNagios XI Configuring FTP For NSClient++ DeploymentNagios XI Configuring Global Event HandlersNagios XI Configuring Inbound ChecksNagios XI Configuring NSClient++Nagios XI Configuring Notification PreferencesNagios XI Configuring Outbound ChecksNagios XI Configuring Passive Services With Nagios XINagios XI Configuring SSL for Nagios XINagios XI Connecting To Your Email ServerNagios XI Conversion for VirtualBoxNagios XI Cool Tips & Tricks NWC14Nagios XI Core Config Manager Bulk Modification ToolNagios XI Core Config Manager Bulk Renaming ToolNagios XI Core Config Manager Configuration SnapshotsNagios XI Core Config Manager Escalation WizardNagios XI Core Config Manager Host GroupsNagios XI Core Config Manager How It WorksNagios XI Core Config Manager Service GroupsNagios XI Core Configuration Mananger Display IssuesNagios XI Core Configuration Mananger Mass ChangesNagios XI Create Actions URL Link In Quick Actions MenuNagios XI Create Host And Service URLs With FiltersNagios XI Creating Nagios XI WizardsNagios XI Cron JobsNagios XI Custom Wizards, Components and Dashlets NWC12Nagios XI Customizing The Landing PageNagios XI DB Maintenance ArchitectureNagios XI Database OptimizationNagios XI Display All Scheduled ReportsNagios XI Distributed Monitoring With NRDPNagios XI Downgrading Nagios CoreNagios XI Downloading A System ProfileNagios XI Email Notifications With ColorNagios XI Enabling Ping ActionNagios XI Enterprise Edition ReportsNagios XI Event Manager ArchitectureNagios XI Excluding Hosts And HostgroupsNagios XI Exploring the Graph ExplorerNagios XI Exporting the Config DatabaseNagios XI Folder Watch WizardNagios XI Gauges Understanding ThresholdsNagios XI Generating GraphsNagios XI Generating Reports With Nagios XINagios XI Google Map IntegrationNagios XI Group Deployment of Service Checks NWC15Nagios XI GroupsNagios XI Host and Service Details OverviewNagios XI Hostgroup InheritanceNagios XI How SNMP Traps WorkNagios XI How SNMP Works A Quick GuideNagios XI How To Achieve High AvailabilityNagios XI How To Apply Configuration Using The APINagios XI How To Check For Windows Updates With Nagios XINagios XI How To Create A Virtual Instance In The Amazon EC2 Cloud EnvironmentNagios XI How To Delete A Data Source From An RRD FileNagios XI How To Install On Windows Using Hyper VNagios XI How To Install On Windows Using VMwareNagios XI How To Install On Windows Using vSphereNagios XI How To Monitor A Websensor EM08Nagios XI How To Monitor Apache ActiveMQ With Nagios XINagios XI How To Monitor Apache TomcatNagios XI How To Monitor Devices Using The NCPA Agent and WizardNagios XI How To Monitor Docker ContainersNagios XI How To Monitor GlassFishNagios XI How To Monitor JBoss/WildFlyNagios XI How To Monitor JMX With Nagios XINagios XI How To Monitor Jetty JMXNagios XI How To Monitor WebLogicNagios XI How To Monitor Website Defacement With Nagios XINagios XI How To Select A DownloadNagios XI How To Test Check Commands From The Command lineNagios XI How To Use CA Certificates With check_ldaps PluginNagios XI How To Use Capacity PlanningNagios XI How To Use Deadpool In Nagios XINagios XI How To Use The Actions ComponentNagios XI How To Use The Bulk Host Cloning & Import WizardNagios XI How To Write Custom ComponentsNagios XI How XI WorksNagios XI How to Authenticate and Import -Users with Active DirectoryNagios XI How to Change Default PasswordsNagios XI How to Configure Email And Text NotificationsNagios XI How to Generate SLA ReportsNagios XI How to Install & Configure the Oracle Client & PluginsNagios XI How to Integrate SNMP Traps With Nagios XINagios XI How to Integrate the Bischeck Plugin Extension with Nagios XINagios XI How to Manage Remote Nagios XI ServersNagios XI How to Manually Update Nagios XINagios XI How to Monitor Apache Cassandra Distributed DatabasesNagios XI How to Monitor an AKCP SensorProbe2 using SNMPNagios XI How to Restart A Windows Service With NRPENagios XI How to Upgrade Using the Web UINagios XI How to Use the NSCA AddonNagios XI Importing Config Files From Nagios Core into Nagios XINagios XI Importing Nagios XI into Microsoft Hyper VNagios XI Inbound Email CommandsNagios XI Installing NSClient++Nagios XI License EntitlementsNagios XI Integrating Mod Gearman With Nagios XINagios XI Integrating Mod_Security With Nagios XINagios XI Integrating NagVis With Nagios XINagios XI Integrating On Call Schedules with Nagios NWC13Nagios XI Integrating PuTTY SSH LinksNagios XI Integrating Slack With Nagios XINagios XI Integrating autoIT With NagiosNagios XI Introduction Getting Started with Nagios XI NWC14Nagios XI Introduction to Event HandlersNagios XI JavaScript and jQuery Tips, Tricks and How To NWC14Nagios XI Leveraging and Understanding Performance Data and Graphs NWC13Nagios XI License Maintenance Status CheckNagios XI Link Directly to Graph Explorer GraphsNagios XI Log Locations and DescriptionsNagios XI Log Monitoring with SwatchNagios XI Log Server Integration WizardNagios XI Logging InNagios XI MRTG Clean ConfigsNagios XI Macros and Custom Object VariablesNagios XI Manage MIBs ArchitectureNagios XI Managing ComponentsNagios XI Managing Mobile CarriersNagios XI Managing Plugins In Nagios XINagios XI Managing UsersNagios XI Manual Backup And Restore DatabasesNagios XI Manual Config File ManagementNagios XI Mass Acknowledgement in Nagios XI 2024Nagios XI Mass Delete Old RRD FilesNagios XI Maximizing Performance In Nagios XINagios XI Migrate Performance DataNagios XI Migrating From Nagios CoreNagios XI Mobile User InterfaceNagios XI Mod Gearman Queues and WorkersNagios XI Modifying The Contents Of /usr/local/nagios/etcNagios XI Monitor Active Directory with LDAPNagios XI Monitoring A MySQL ServerNagios XI Monitoring A Nagios XI ServerNagios XI Monitoring A Router Or SwitchNagios XI Monitoring A Website URLNagios XI Monitoring A Windows DesktopNagios XI Monitoring AIX With NagiosNagios XI Monitoring An FTP ServerNagios XI Monitoring An LDAP ServerNagios XI Monitoring Apache Tomcat With XINagios XI Monitoring DNS QueriesNagios XI Monitoring Hosts Using NRPE and NRPE Monitoring WizardNagios XI Monitoring Hosts Using SSHNagios XI Monitoring Linux ServersNagios XI Monitoring Linux Using NRPE and Linux Server Monitoring WizardNagios XI Monitoring Linux Using SNMPNagios XI Monitoring Microsoft SQLNagios XI Monitoring MongoDBNagios XI Monitoring OS/X with Nagios XINagios XI Monitoring Performance Counters in Nagios Using NCPANagios XI Monitoring Performance Counters in Nagios Using NSClient++Nagios XI Monitoring TCP/UDP PortsNagios XI Monitoring Unconfigured ObjectsNagios XI Monitoring Using the Full Power of Nagios XI Enterprise NWC15Nagios XI Monitoring VMware Virtualization Using vMA NWC14Nagios XI Monitoring VMware With Nagios XINagios XI Monitoring Websites With Nagios XINagios XI Monitoring Windows ServersNagios XI Monitoring Windows Using NSClient++Nagios XI Monitoring Windows With NCPANagios XI Monitoring Windows With SNMPNagios XI Monitoring the Nagios XI localhostNagios XI Moving Your XI InstallationNagios XI Multi Tech iSMS IntegrationNagios XI MultiTech MTR API IntegrationNagios XI MySQL/MariaDB Max ConnectionsNagios XI NSP Sorry Dave, I can’t let you do thatNagios XI Nagios AgentsNagios XI Nagios Network Analyzer Reports In XINagios XI Nagios Rapid Deployment Options NWC14Nagios XI Navigating The Nagios XI DashboardNagios XI Network Status Map Customization (Legacy)Nagios XI Network Status Map CustomizationNagios XI Non Administrative UsersNagios XI Offloading MySQL to Remote ServerNagios XI Optimizing The PHP Settings FileNagios XI Overview of ReportingNagios XI Passive Monitoring With NRDS_WinNagios XI Passive Monitoring with NRDSNagios XI Performance Data ArchitectureNagios XI Performance Data AveragingNagios XI Performance Graphs & Graph ExplorerNagios XI Ports And ProtocolsNagios XI Receiving SNMP Traps From Nagios Network AnalyzerNagios XI Recurring Downtime SystemNagios XI Redundancy And Security PlanningNagios XI Removing All Historical DataNagios XI Restarting A Linux Service With NRPENagios XI Restarting Linux Services With NCPANagios XI Restarting Windows Services With NCPANagios XI Restoring A Configuration SnapshotNagios XI Restoring Default ConfigurationNagios XI Running Auto Discovery JobsNagios XI SNMP Monitoring SeriesNagios XI SNMP Trap HardeningNagios XI SNMP Trap TutorialNagios XI SNMP Trap v3 ConfigurationNagios XI SNMP Traps with NXTINagios XI STRICT_TRANS_TABLESNagios XI Scheduled Backup Log LevelNagios XI Scheduling Reports and PagesNagios XI Scheduling ReportsNagios XI Securing Your Nagios Server NWC13Nagios XI Sending SNMP TrapsNagios XI Service DependenciesNagios XI Setup Nagios XI to Send SMS AlertsNagios XI Should You Change RRD Retention PeriodsNagios XI Solaris Monitoring OptionsNagios XI Special CharactersNagios XI Standard Edition ReportsNagios XI Switch and Router Wizard ArchitectureNagios XI System RequirementsNagios XI Terminology OverviewNagios XI Two Factor AuthenticationNagios XI Under the Hood NWC15Nagios XI Understanding And Using Configuration WizardsNagios XI Understanding And Using DashboardsNagios XI Understanding And Using XI ToolsNagios XI Understanding Email SendingNagios XI Understanding Multi TenancyNagios XI Understanding Notification EscalationsNagios XI Understanding Notification VariablesNagios XI Understanding The User Macros ComponentNagios XI Understanding User MacrosNagios XI Understanding User PermissionsNagios XI Understanding the Nagios XI Directory StructureNagios XI Update Components And WizardsNagios XI Update Default snmptt.conf EVENTNagios XI Upgrading Nagios CoreNagios XI User GuideNagios XI Upgrading The Linux NRPE AgentNagios XI Uploading and Managing MIBSNagios XI Users And ContactsNagios XI Using Auto DiscoveryNagios XI Using DUO Two Factor AuthenticationNagios XI Using Different Notification MethodsNagios XI Using NSClient++ For Passive ChecksNagios XI Using Nagios BPINagios XI Using Nagios XI As A Security Tool Software VersionsNagios XI Using Nagios XI As A Security Tool Website DefacementNagios XI Using Recurring DowntimeNagios XI Using SSL with XI Active DirectoryNagios XI Using Scripts / Plugins With NCPANagios XI Using Scripts / Plugins With NSClient++Nagios XI Using The Config Import Prep ToolNagios XI Using The Core Config Manager For Host ManagementNagios XI Using The Core Config Manager For Service ManagementNagios XI Using The Custom Includes ComponentNagios XI Using The Host And Service Object Notes ComponentNagios XI Using The SNMP Walk WizardNagios XI Using The Traceroute ActionNagios XI Using ViewsNagios XI Using rrdcached with Nagios XINagios XI Using the Negate PluginNagios XI Utilizing Data Visualizations in Systems Management -NWC14Nagios XI Utilizing a RAM Disk in Nagios XINagios XI Virtual Machine NotesNagios XI WatchGuard Wizard UsageNagios XI Web Interface ArchitectureNagios XI What Is A Performance CounterNagios XI Wizards AchitectureNagios XI XI Server ConsiderationsNagios Xi Masquerading As Another UserNetwork Monitoring With NagiosNon Admin Walkthrough of Nagios XIParent/Child Host RelationshipsStarting a Nagios XI TrialTemplate IntroductionThird Party Plugins in Nagios XITwilio SMS IntegrationUnderstanding Hosts and Services in Nagios XIUnderstanding Tools in Nagios XIUsing The Generic Plugin Monitoring Wizard In Nagios XIUsing the Nagios XI World MapViewing Configuration Snapshot differencesWebInject InstructionsWorking with Hosts on the Mobile InterfaceWorking with Services on the Mobile InterfaceXI 5.10.0 and newer Postgress to MySQL ConversionOvercoming lack of VMware SDK with VMware Wizard

Nagios XI - MySQL/MariaDB - Max Connections

Overview

This KB article is about the MySQL / MariaDB database and adjusting the maximum connections allowed. This can be required in larger XI installations.

Historically MySQL has been the database used by Nagios XI, however in CentOS 7 & Debian 9 onwards MariaDB is used instead of MySQL. MariaDB is simply a fork of the MySQL database however some of the command differ slightly. This document will highlight the different commands for each scenario.

This KB article applies to Nagios XI implementations that have the database server on the same server as Nagios XI (default) OR if you have offloaded the database server to an external server.

This KB article covers three topics:

  1. Identifying the current maximum connections allowed and what it has peaked at
  2. Increasing the maximum connections allowed to the database application
  3. Ongoing monitoring of the connections to help identify if they need increasing in the future

Generally you'll be reading this article because you may have noticed events like this in your log files:

PHP Warning:  mysql_connect(): Too many connections

Identifying Connections

By default, the database server allows 151 connections. You can determine the current maximum allowed connections using this command:

mysql -uroot -pnagiosxi -e "show variables like 'max_connections';"

The output will be something like this:

+-----------------+-------+
| Variable_name   | Value |
+-----------------+-------+
| max_connections | 151   |
+-----------------+-------+

How do you know if you need to increase this value? We can run another query that shows us what the peak number of connections has been since the database server daemon was started:

mysql -uroot -pnagiosxi -e "show global status like 'Max_used_connections';"

The output will be something like this:

+----------------------+-------+
| Variable_name        | Value |
+----------------------+-------+
| Max_used_connections | 65    |
+----------------------+-------+

If the number returned is the same as (or close to max_connections) then you need to increase the allowed number of max_connections.

If you have an offloaded database server, execute those commands on the offloaded database server.

Increasing Max Connections

In this example we are going to define max_connections at 1000.

It has been observed that MariaDB can only have it's max_connections= set to a maximum of 818. If you use any value greater MariaDB will default back to a value of 214. In the steps below if you are using MariaDB you should use 818 instead of 1000.

On your Nagios XI server OR your offloaded database server, edit the config file with the following command:

**RHEL | CentOS | Oracle Linux
**

vi /etc/my.cnf

**RHEL 8 | CentOS 8 | Centos Stream
**

vi /etc/my.cnf.d/mysql-server.cnf

**Ubuntu 16/18/20
**

vi /etc/mysql/mysql.conf.d/mysqld.cnf

**Debian 9/10
**

vi /etc/mysql/mariadb.conf.d/50-server.cnf

When using the vi editor, to make changes press i on the keyboard first to enter insert mode. Press Esc to exit insert mode.

Add the following lines in the section [mysqld]

max_connections=1000
open_files_limit = 4096

If the lines already exists, simply change the value to a higher number.

When you have finished, save the changes in vi by typing:

:wq

and press Enter.

Now execute the following commands (three sets of commands required):

Nagios XI Server (part 1):

**RHEL | CentOS | Oracle Linux | Debian | Ubuntu
**

systemctl stop nagios.service 
systemctl stop ndo2db.service (Nagios 5.6 and lower only)

Nagios XI Server OR Offloaded Database Server (part 2):

**RHEL 7| CentOS 7| Oracle Linux 7| Debian 9/10
**

systemctl restart mariadb.service

**RHEL 8| CentOS 8| Oracle Linux 8 | Centos Stream
**

systemctl restart mysqld.service

**Ubuntu 16/18/20
**

systemctl restart mysql.service

Nagios XI Server (part 3):

RHEL| CentOS | Oracle Linux | Debian | Ubuntu 16/18/20

systemctl start ndo2db.service (Nagios XI 5.6 or lower only)

systemctl start nagios.service

Once you have performed these steps, you can execute the commands outlined in the Identifying Connections section of this KB article to ensure the changes have applied.

Ongoing Monitoring

Now that you have made the changes, you should create some Nagios services to monitor the connections. This will allow you to observe the changes you have made as you may need to increase them again in the future.

There are two different metrics we will monitor:

  • Max_used_connections

    • The maximum number of connections that have been in use simultaneously since the server started
  • Threads_connected

    • The number of currently open connections

The services will generate performance graphs, which will help identify trends. First, we need to create a user account in the database server that can access these metrics. This read only account will not be granted access to any of the databases, it is simply used to query the information_schema internal database.

In the following commands, the username is readonly and the password is readonly_password

Nagios XI Server

echo "CREATE USER 'readonly'@'localhost' IDENTIFIED BY 'readonly_password';" | mysql -u root -p'nagiosxi'

Newer versions of MYSQL the performance_schema table needs to be used and the grants for the readonly user for the performance_schema has to be added by running this command.

echo "GRANT SELECT ON performance_schema.* TO 'readonly'@'localhost';" |mysql -u root -pxxxxxxxxxxxxxxx

*Offloaded Database Server:
*

If you have an offloaded database server, you will need to run this command instead. This command uses 10.25.5.2 as the IP address of the Nagios XI server. You will need to change this to the IP address of your Nagios XI server.*
*

echo "CREATE USER 'readonly'@'10.25.5.2' IDENTIFIED BY 'readonly_password';" | mysql -u root -p'nagiosxi'

Newer versions of MYSQL the performance_schema table needs to be used and the grants for the readonly user for the performance_schema has to be added by running this command.

echo "GRANT SELECT ON performance_schema.* TO 'readonly'@'10.25.5.2';" |mysql -u root -pxxxxxxxxxxxxxxx

Now we can test the plugin commands before creating the services. Nagios XI comes bundled with the check_mysql_query plugin which will be used for the services.

This command checks the Max_used_connections and has the critical threshold of 1000:

Newer versions of MYSQL the performance_schema table needs to be used so update this option from

-d information_schema

to

-d performance_schema

In the following examples and for the $ARG2$ examples below.

Nagios XI Server

/usr/local/nagios/libexec/check_mysql_query -u readonly -preadonly_password -d information_schema -q "select variable_value from global_status where Variable_name='Max_used_connections'"  -c :1000

Nagios XI Server Connecting To Remote Database Server:

/usr/local/nagios/libexec/check_mysql_query -H offloaded_server -u readonly -preadonly_password -d information_schema -q "select variable_value from global_status where Variable_name='Max_used_connections'" -c :1000

The output will be something like this:

QUERY OK: 'select variable_value from global_status where Variable_name='Max_used_connections';' returned 67.000000 | result=67.000000;;1000.000000;

This command checks the Threads_connected and has the warning threshold of 900:

Nagios XI Server

/usr/local/nagios/libexec/check_mysql_query -u readonly -preadonly_password -d information_schema -q "select variable_value from global_status where Variable_name='Threads_connected'" -w :900

Nagios XI Server Connecting To Remote Database Server:

/usr/local/nagios/libexec/check_mysql_query -H offloaded_server -u readonly -preadonly_password -d information_schema -q "select variable_value from global_status where Variable_name='Threads_connected'" -w :900

The output will be something like this:

QUERY OK: 'select variable_value from global_status where Variable_name='Threads_connected';' returned 42.000000 | result=42.000000;900.000000;;

After testing that both of those commands worked, the next step is to create the services in Nagios XI.

Click the Configure menu

Click Core Configuration Manager

In the left pane under Commands click Commands

Click the +Add New button

Populate the fields as follows:**
**

Command Namecheck_mysql_query
Command Line$USER1$/check_mysql_query $ARG1$ $ARG2$ $ARG3$
Command Typecheck command
ActiveChecked

Click Save

In the left pane under Monitoring click Services

Click the +Add New button

This is for Max_used_connections

Populate the fields on each tab as follows:

Common Settings

Config Namelocalhost
DescriptionDatabase Max_used_connections
Manage Hosts buttonSelect localhost
Manage Templates buttonSelect xiwizard_mysqlquery_service
Activechecked
Check commandcheck_mysql_query
$ARG1$-u readonly -p'readonly_password'
$ARG2$-d information_schema -q "select variable_value from global_status where Variable_name='Max_used_connections'"
$ARG3$-c :1000

Check Settings

Check interval15
Retry interval5
Max check attempts6
Check periodxi_timeperiod_24x7

Alert Settings

Complete any notification options as required

Click Save

Click the +Add New button

This is for Threads_connected

Populate the fields on each tab as follows:

Common Settings

Config Namelocalhost
DescriptionDatabase Threads_connected
Manage Hosts buttonSelect localhost
Manage Templates buttonSelect xiwizard_mysqlquery_service
Activechecked
Check commandcheck_mysql_query
$ARG1$-u readonly -p'readonly_password'
$ARG2$-d information_schema -q "select variable_value from global_status where Variable_name='Threads_connected'"
$ARG3$-w :900

Check Settings

Check interval15
Retry interval5
Max check attempts6
Check periodxi_timeperiod_24x7

Alert Settings

Complete any notification options as required

Click Save

Click Apply Configuration

In the services above, if you have an offloaded database server, change the following:

Common Settings

Config NameThe name of the offloaded database server (you'll need a host object for this)
Manage Hosts buttonSelect the offloaded database server
Activechecked
Check commandcheck_mysql_query
$ARG1$-H offloaded_server -u readonly -p'readonly_password'

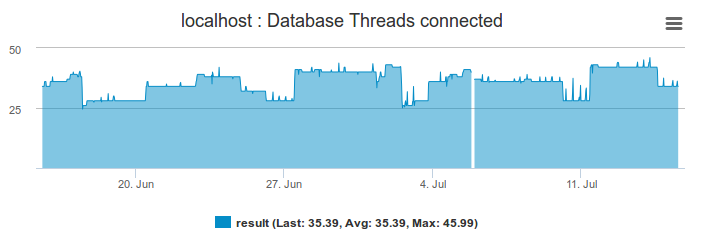
Here are some performance graphs to demonstrate the history collected by these services.

Final Thoughts

For any support related questions please visit the Nagios Support Forums at:

Nagios Support Forums

Nagios Enterprises, LLC

© All rights reserved. 2026