Library

Docs
Beta

Products

Adding Additional Instances To ClusterAlerting On Log EventsAnalyzing LogsAuthenticating and Importing Users with AD and LDAPChanging Data Store PathConfiguring FiltersConfiguring InputsConfiguring Multi Tenancy in Nagios Log ServerConfiguring NXLog To Send Additional Log FilesCreating a Log Server DashboardForwarding Logs from Nagios Log Server to Another DestinationHow To Configure NXLog To Send Multi line Logs To Nagios Log Server.How To Configure Windows To Send Logs To Nagios Log ServerHow To Create A Nagios Log Server Instance In The Amazon EC2 CloudHow To Export Or Schedule Reports In Nagios Log ServerHow To integrate Nagios Log Server with XIHow to Backup and Restore the Nagios Log ServerHow to use a Proxy Server with Nagios Log ServerIntegrating Nagios Log Server with Nagios XILog Server Dashboard OverviewManaging ClustersManaging IndicesManaging Snapshots and MaintenanceMonitoring A New Log SourceMonitoring Apache Logs with Nagios Log ServerMonitoring Linux System Logs using Nagios Log ServerMonitoring Squid Proxy Server With Nagios Log ServerNagios Log Server Adding Additional Instances To ClusterNagios Log Server Administrator GuideNagios Log Server Alerting On Log EventsNagios Log Server Analyzing LogsNagios Log Server Architecture and Overview NWC15Nagios Log Server Changing Data Store PathNagios Log Server Cluster Timezone SettingsNagios Log Server Configuration OverviewNagios Log Server Configuring Input FiltersNagios Log Server Configuring InputsNagios Log Server Configuring NXLog To Send Additional Log FilesNagios Log Server Configuring NXLog To Send Multi Line Log FilesNagios Log Server Conversion for VirtualBoxNagios Log Server Custom Alert Message Email TemplateNagios Log Server Data Backup and ArchivingNagios Log Server ELK documentationNagios Log Server ESXi Syslog ConfigNagios Log Server Exporting Log DataNagios Log Server Full Architecture OverviewNagios Log Server How To Configure SSLNagios Log Server How To Create A Nagios Log Server Instance In The Amazon EC2 Cloud EnvironmentNagios Log Server How To Install Using VMwareNagios Log Server How To Select A DownloadNagios Log Server Important Files And DirectoriesNagios Log Server Introduction WebinarNagios Log Server Jobs Subsystem ArchitectureNagios Log Server License EntitlementsNagios Log Server Listening On Privileged PortsNagios Log Server Log Monitoring and Log Management with Nagios NWC14Nagios Log Server Logging InNagios Log Server Managing ClustersNagios Log Server Managing IndicesNagios Log Server Managing InstancesNagios Log Server Managing Snapshots and MaintenanceNagios Log Server Managing UsersNagios Log Server Monitor Your Log Server InstancesNagios Log Server Monitoring A New Log SourceNagios Log Server Offline UpgradeNagios Log Server Overview And TerminologyNagios Log Server Performance And Storage WalkthroughNagios Log Server Poller Subsystem ArchitectureNagios Log Server Real Life Experience of Nagios Log Server NWC15Nagios Log Server Removing An Instance From A ClusterNagios Log Server Sending Multiline Log Files Using SyslogNagios Log Server Sending NXLogs With SSLNagios Log Server Sending Nagios Core Logs To Nagios Log ServerNagios Log Server Sending syslog with SSL/TLSNagios Log Server Single Instance DeploymentNagios Log Server Updating Logstash PatternsNagios Log Server Upgrade InstructionsNagios Log Server Using An Output To Create Nagios XI Passive ObjectsNagios Log Server Using GeoIP DataNagios Log Server Using The Custom Includes PageRemoving An Instance From A ClusterSend Alerts Based on the Log Server Audit LogSending ESXi Logs To Nagios Log ServerSending Mac OS X Logs To Nagios Log ServerSending NXLogs With SSL/TLSSending Nagios Core Logs To Nagios Log ServerSending syslog With SSL/TLSUpgrade Nagios Log ServerUsing An Output To Create Nagios XI Passive ObjectsWaiting for Database StartupNagios Log Server Monitoring Using NCPA + Nagios XI

Log Server Dashboard Overview

Dashboard Overview

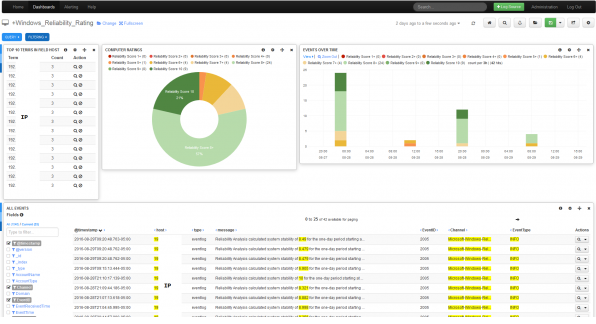
Dashboards represent visualization of data within Nagios Log Server. Dashboards typically have a query and filters assigned to them which ultimately determine the data set being analyzed. See Configuring Filters for more information.

Dashboard Example

Creating a Log Server Dashboard

Global vs My Dashboards

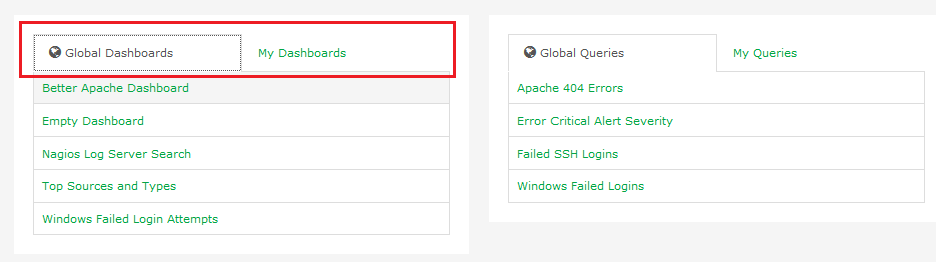
From the Home page on the right, you’ll find a short listing of Global and My Dashboards. The difference is that Users with limited access can only see their own dashboards, while Admin users have the ability to view and edit other users dashboards.

Importing Dashboards

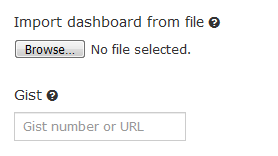
It’s also possible to download dashboards from the Nagios Exchange and import them into Log Server.

From the Dashboards page choose Load > Advanced > Import Dashboard from File.

Rows and Panels

Dashboards are made of rows and panels. The panels are populated with graphs, tables and other visualizations. 

Near the bottom of any given dashboard, you should see a  button. This allows you to add a row to the dashboard that acts as a container for your panels.

Once the row has been created, you can click the Add A Panel button to add your first panel. Subsequent panels can be added by using the blue menu on the left-hand side of the panel. This blue menu also allows you to modify the row itself or collapse it from view.

There are a few different types of panels that examine different things. The most commonly used panel is the "terms" panel which displays information about what a certain field’s value is or is not. Other panels can contain more specific fields from your data set, examine averages over a period of time, display aggregate results based on location (useful when geotagging IP addresses to spot traffic), and all sorts of applications in-between.

Dashboard Building Blocks

There are several building blocks for creating new dashboards: time periods, queries, filters and visualizations.

Time PeriodsQueriesFiltersVisualizations
Chosen from the drop down list in the upper right. The defalt time period is the last 24 hours.Limit the dashboard data by performing searches on data by categories, messages, log types...etc. You can define multiple queries and set the color.Similar to queries, filters are used to limit the data in the dashboard. You can assign multiple filters.As explained above, graphs, tables and other visualizations are assigned to panels within rows.

References

Analyzing Logs with Nagios Log Server

Nagios Enterprises, LLC

© All rights reserved. 2026