Products
Nagios Network Analyzer - Reports
Overview
What are reports? Reports are a way to quickly get aggregated data about the entire source or source group based on a few specified items such as source ip, destination ip, source port, and destination port. These are standard data in any flow type. They show where the flow data is going. These reports aggregate all the flow data for a specific ip or port based on those two things. Basically, you get to see how much data was sent/received by an ip or port.
Creating Reports
There are two ways to create reports. The first, is from the reports tab on the header of Network Analyzer. The second, is by selecting the source or source group you'd like to see a report on. You can also run anonymous reports on sources and source groups without having to save the report if you're in the reports tab inside a source or source group.
Creating a Report from the Header Report Tab
From the main web interface page of the Nagios Network Analyzer, select Reports tab at the top of the page. Here you will be greeted be a page with several options:
-
Delete – Allows you to remove a selected report.
-
Create report – Allows you to create a new report.
-
Search reports – Allows you to search through all of your reports.
And also a vertical table which you can select your saved reports from.
Now simply click the Create Report button. Here you give the report a title and select what amount of the top talkers you would like to show. Note: "For example, by choosing (10) for the Display top # section you would see results for the top 10 talkers "or most active groups as shown in the image." Now, select the Time Range you would like the report to look back to, and select the Group By type: Source IP, Destination IP, Source Port, or Destination Port. Finally, select in what way you would like the report Ordered By: Flows, Packets, or Bytes.
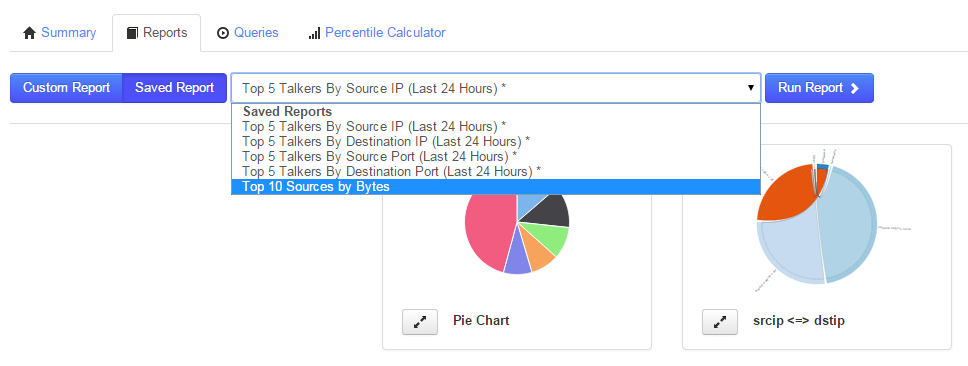
Once you click Create, you will see the new report added to the list on the Reports page under [Report Name]. Now select one of your sources from the sources page, click it's reports tab, and select your new custom report from the drop down list at the top of the page as shown in the image below.
Creating a Report From the Source or Source Group Report Tab
You can also create reports inside the source or source group tabs by clicking the Custom Report button as shown below.
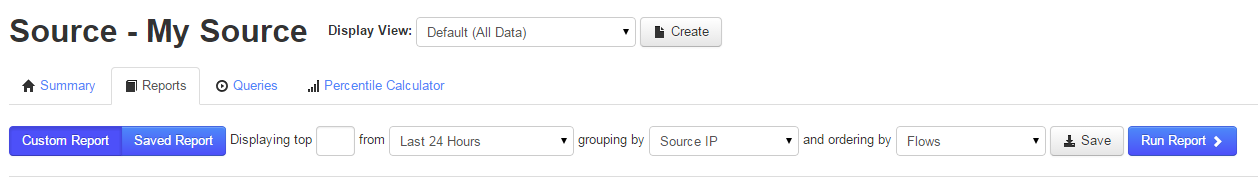
This has the same options as creating a report using the main reports page but allows you to generate a report on the fly. These reports can be run before you save them, thus allowing you to test the report to see if it's showing the kind of information you want. Once you're ready to save the report you click the Save button and name the report. Once a report is saved you will be able to use the report on any source or source group you have.
Final Thoughts
For any support related questions please visit the Nagios Support Forums at: