Products
Nagios Log Server - Logs Not Searchable or Not Coming In
Overview
When running a query in a dashboard, logs are not showing up when they should be. This guide will go through the steps to diagnose what is causing the issue.
This article will use a scenario of a remote server sending syslogs to help provide a clear troubleshooting path.
-
Log Server
-
Name: nls-c7x-x64
-
IP: 10.25.5.86
-
Listening Port: TCP 5544
-
-
Remote Server Sending Logs
-
Name: centos12
-
IP: 10.25.13.30
-
Sending Port: TCP 5544
-
OS: CentOS 6.7 x64
-
Remote Server - Check Rsyslog Config
This server has already been setup to send logs to nls-c7x-x64 using the setup steps in the Log Server GUI.
To confirm this has been done, the following file has been created and contains the following:
/etc/rsyslog.d/99-nagioslogserver.conf
### Begin forwarding rule for Nagios Log Server                           NAGIOSLOGSERVER
$WorkDirectory /var/lib/rsyslog # Where spool files will live             NAGIOSLOGSERVER
$ActionQueueFileName nlsFwdRule0 # Unique name prefix for spool files     NAGIOSLOGSERVER
$ActionQueueMaxDiskSpace 1g   # 1GB space limit (use as much as possible) NAGIOSLOGSERVER
$ActionQueueSaveOnShutdown on # Save messages to disk on shutdown         NAGIOSLOGSERVER
$ActionQueueType LinkedList   # Use asynchronous processing               NAGIOSLOGSERVER
$ActionResumeRetryCount -1    # Infinite retries if host is down          NAGIOSLOGSERVER
# Remote host is: name/ip:port, e.g. 192.168.0.1:514, port optional       NAGIOSLOGSERVER
*.* @@nls-c7x-x64:5544                                               # NAGIOSLOGSERVER
### End of Nagios Log Server forwarding rule                              NAGIOSLOGSERVER
It's important to note here the following line:
*.* @@nls-c7x-x64:5544 # NAGIOSLOGSERVER
It's assumed that the server centos12 can resolve the address nls-c7x-x64, otherwise it won't be able to send it logs. To confirm this, execute the following command on centos12:
ping nls-c7x-x64 -c 1
Output similar to this is expected if it can successfully resolve nls-c7x-x64:
PING nls-c7x-x64.box293.local (10.25.5.86) 56(84) bytes of data.
64 bytes from nls-c7x-x64.box293.local (10.25.5.86): icmp_seq=1 ttl=64 time=0.273 ms

--- nls-c7x-x64.box293.local ping statistics ---
1 packets transmitted, 1 received, 0% packet loss, time 2ms
rtt min/avg/max/mdev = 0.273/0.273/0.273/0.000 ms
Output similar to this is expected if it CANNOT successfully resolve nls-c7x-x64:
ping: unknown host nls-c7x-x64
Going back to that config line:
*.* @@nls-c7x-x64:5544 # NAGIOSLOGSERVER
The @@ indicates that the port type is TCP and the port number is 5544.
IF it was UDP there would only be one @.
Remote Server - Check Rsyslog Is Running
Assuming the config is correct, you may want to make sure that rsyslogd is running:
service rsyslog status
Output similar to this is expected if it is running:
rsyslogd (pid 2098) is running...
Output similar to this is expected if it is NOT running:
rsyslogd is stopped
If it is not running, you should start it:
service rsyslog start
Remote Server - Check Firewall Rules
You want to make sure that the iptables firewall allows outbound traffic. By default there is no restrictions on outbound traffic, to confirm this execute the following command:
iptables --list
Output similar to this is expected:
Chain INPUT (policy ACCEPT)
target     prot opt source               destination
ACCEPT     all  --  anywhere             anywhere            state RELATED,ESTABLISHED
ACCEPT     icmp --  anywhere             anywhere
ACCEPT     all  --  anywhere             anywhere
ACCEPT     tcp  --  anywhere             anywhere            state NEW tcp dpt:ssh
REJECT     all  --  anywhere             anywhere            reject-with icmp-host-prohibited

Chain FORWARD (policy ACCEPT)
target     prot opt source               destination
REJECT     all  --  anywhere             anywhere            reject-with icmp-host-prohibited

Chain OUTPUT (policy ACCEPT)
target     prot opt source               destination
Specifically this last output is what we need to look at:
Chain OUTPUT (policy ACCEPT)
target     prot opt source               destination
The first line has (ACCEPT) which means there is no restriction at the top level (it would say DROP if there was).
The second line is simply headings for all the outbound rules that have been defined. Because there is no third line, there are NO outbound rules defined so the default here is to ACCEPT all outbound traffic (allow it).
IF you had a restricted environment where outbound rules were DROP, you would need to add an outbound firewall rule for TCP port 5544 to nls-c7x-x64 on 10.25.5.86:
iptables -I OUTPUT -p tcp --destination-port 5544 -d 10.25.5.86 -j ACCEPT
service iptables save
Remote Server - Watch Outbound Traffic
To confirm that the log traffic is leaving the remote server we can run a tcpdump to watch the traffic.
First we must install tcpdump:
yum -y install tcpdump
Wait while tcpdump is installed.
Now execute the following command to watch the traffic:
tcpdump src host 10.25.13.30 and tcp dst port 5544 and dst host 10.25.5.86
You'll receive this message first:
tcpdump: verbose output suppressed, use -v or -vv for full protocol decode
listening on eth0, link-type EN10MB (Ethernet), capture size 65535 bytes
An example of traffic flowing is as follows:
16:43:49.001130 IP centos12.box293.local.60907 > nls-c7x-x64.box293.local.5544: Flags [P.],
seq 2751017526:2751017581, ack 431734015, win 115, options [nop,nop,TS val 93111400 ecr 92667575], length 55
If you don't see any traffic, it may just be that nothing is being logged and hence there is nothing to send. You can easily add a test entry to rsyslog which will generate traffic:
- Open an additional ssh session to the remote server (centos12)
- Execute the following command:
logger TroubleshootingTest
In your other SSH session you should now see a line of traffic which confirms that rsyslog is sending the logs onto nls-c7x-x64.
Press Ctrl C to stop the tcpdump.
Log Server - Watch Inbound Traffic
To confirm that the log traffic is entering log server we can run a tcpdump to watch the traffic. This is similar to the previous steps except it confirms that the traffic has made it through any routers or firewalls between the remote server and the log server.
First we must install tcpdump with this command:
RHEL | CentOS
yum install -y tcpdump
Debian | Ubuntu
apt-get install -y tcpdump
Now execute the following command to watch the traffic:
tcpdump src host 10.25.13.30 and tcp dst port 5544 and dst host 10.25.5.86
You'll receive this message first:
tcpdump: verbose output suppressed, use -v or -vv for full protocol decode
listening on eth0, link-type EN10MB (Ethernet), capture size 65535 bytes
An example of traffic flowing is as follows:
16:52:42.509481 IP centos12.box293.local.60907 > nls-c7x-x64.box293.local.5544: Flags [P.],
seq 2751017651:2751017706, ack 431734015, win 115, options [nop,nop,TS val 93644443 ecr 92674681], length 55
If you don't see any traffic, it may just be that nothing is being logged and hence there is nothing to send. You can easily add a test entry to rsyslog which will generate traffic:
- Open an additional ssh session to the remote server (centos12)
- Execute the following command:
logger TroubleshootingTest
In your log server SSH session you should now see a line of traffic which confirms that the traffic is hitting the log server.
Press Ctrl C to stop the tcpdump.
IF you don't see any traffic, then there may be a firewall or router blocking the traffic.
Log Server - Check Firewall Rules
You want to make sure that the iptables firewall allows inbound traffic. By default there are restrictions on inbound traffic however Nagios Log Server creates the firewall rules to allow the traffic.
RHEL 7 +| CentOS 7 +
First check the status of the firewall:
systemctl status firewalld.service
IF the firewall is running, it should product output like:
● firewalld.service - firewalld - dynamic firewall daemon
   Loaded: loaded (/usr/lib/systemd/system/firewalld.service; enabled; vendor preset: enabled)
   Active: active (running) since Thu 2018-12-13 11:16:59 AEDT; 39min ago
     Docs: man:firewalld(1)
 Main PID: 670 (firewalld)
   CGroup: /system.slice/firewalld.service
           └─670 /usr/bin/python -Es /usr/sbin/firewalld --nofork --nopid
IF the firewall is NOT running, it will produce this output:
● firewalld.service - firewalld - dynamic firewall daemon
   Loaded: loaded (/usr/lib/systemd/system/firewalld.service; enabled; vendor preset: enabled)
   Active: inactive (dead) since Thu 2018-12-13 11:57:15 AEDT; 1s ago
     Docs: man:firewalld(1)
  Process: 670 ExecStart=/usr/sbin/firewalld --nofork --nopid $FIREWALLD_ARGS (code=exited, status=0/SUCCESS)
 Main PID: 670 (code=exited, status=0/SUCCESS)
If the firewall is NOT running, this means that inbound traffic is allowed.
To ENABLE the firewall on boot and to start it, execute the following commands:
systemctl enable firewalld.service
systemctl start firewalld.service
To list the firewall rules execute this command:
firewall-cmd --list-all
Which should produce output like:
public (active)
  target: default
  icmp-block-inversion: no
  interfaces: ens32
  sources:
  services: dhcpv6-client ssh
  ports: 80/tcp 443/tcp 9300-9400/tcp 3515/tcp 5544/tcp 2056/tcp 2057/tcp 5544/udp
  protocols:
  masquerade: no
  forward-ports:
  source-ports:
  icmp-blocks:
  rich rules:
Specifically, the ports line tells us that the firewall rule exists and is allowing inbound UDP and TCP traffic on port 5544:
ports: 80/tcp 443/tcp 9300-9400/tcp 3515/tcp 5544/tcp 2056/tcp 2057/tcp 5544/udp
If this firewall rules DO NOT exist, they it can be added by executing the following commands:
firewall-cmd --zone=public --add-port=5544/udp
firewall-cmd --zone=public --add-port=5544/tcp
firewall-cmd --reload
Debian
Debian has the iptables firewall installed but not enabled by default. The firewall rules are maintained by the netfilter-persistent service, this is not installed by default. You can determine if it is installed with the following command:
systemctl status netfilter-persistent.service
If you receive this output then there is no firewall service active on your Debian machine:
Unit netfilter-persistent.service could not be found.
This means all inbound traffic is allowed, you will receive SNMP Traps.
If you receive this output then the firewall service is active on your Debian machine:
● netfilter-persistent.service - netfilter persistent configuration
   Loaded: loaded (/lib/systemd/system/netfilter-persistent.service; enabled)
   Active: active (exited) since Tue 2018-11-27 14:24:11 AEDT; 1min 26s ago
 Main PID: 17749 (code=exited, status=0/SUCCESS)
If the netfilter-persistent service is enabled you can now check the status of the firewall:
iptables --list
An open firewall config would produce output like:
Chain INPUT (policy ACCEPT)
target     prot opt source               destination

Chain FORWARD (policy ACCEPT)
target     prot opt source               destination

Chain OUTPUT (policy ACCEPT)
target     prot opt source               destination
You can see no rules exist.
If a rule did exist allowing inbound UDP traffic on port 162 then it would look like this:
target     prot opt source               destination
ACCEPT     udp  --  anywhere             anywhere             udp dpt:snmp-trap
If this firewall rules DO NOT exist, they it can be added by executing the following commands:
iptables -I INPUT -p udp --destination-port 5544 -j ACCEPT
iptables -I INPUT -p tcp --destination-port 5544 -j ACCEP
Ubuntu
Ubuntu uses the Uncomplicated Firewall (ufw) to manage firewall rules however it is not enabled on a default install. You can check if it is enabled with the following command:
ufw status
IF the firewall is NOT running, it will produce this output:
Status: inactive
IF the firewall is running, it should product output like:
Status: active
If the firewall is NOT running, this means that inbound traffic is allowed (you will receive SNMP Traps).
To ENABLE the firewall on boot and to start it, execute the following command:
ufw enable
Be careful executing this command, you will not be able to access the server when it next reboots as the default configuration is to deny all incoming connections. You will need to add rules for all the different ports connect to this server.
To list the firewall rules execute this command:
ufw status verbose
Which should produce output like:
Status: active
Logging: on (low)
Default: deny (incoming), allow (outgoing), disabled (routed)
New profiles: skip

To                         Action      From
--                         ------      ----
5544/udp                   ALLOW IN    Anywhere
5544/tcp                   ALLOW IN    Anywhere
5544/udp (v6)              ALLOW IN    Anywhere (v6)
5544/tcp (v6)              ALLOW IN    Anywhere (v6)
You can see from the output that firewall rules exists allowing inbound UDP and TCP traffic on port 5544
If this firewall rules DO NOT exist, they can be added by executing the following commands:
ufw allow proto udp from any to any port 5544
ufw allow proto tcp from any to any port 5544
ufw reload
Log Server - Check Logstash Is Running
Assuming the config is correct, you may want to make sure that logstash is running:
RHEL 7 + | CentOS 7 +| Debian | Ubuntu 16/18/20
systemctl status logstash.service
Output similar to this is expected if it is running:
Logstash Daemon (pid 1171) is running...
Output similar to this is expected if it is NOT running:
Logstash Daemon is stopped
If it is not running, you should start it:
RHEL 7 + | CentOS 7 + | Debian | Ubuntu 16/18/20
systemctl start logstash.service
Log Server - Check Log Server Is Listening
You want to make sure that the server is listening to port 5544. To check, execute the following command:
netstat -nal | grep 5544
Output similar to this is expected:
tcp        0      0 :::5544                     :::*                        LISTEN
tcp        0      0 ::1:56104                   ::1:5544                    ESTABLISHED
tcp        0      0 ::1:5544                    ::1:56104                   ESTABLISHED
udp        0      0 :::5544                     :::*
IF it wasn't listening then there would be no output to that command OR the TCP ports would not appear. Follow this article to make sure Log Server is correctly configured:
Documentation - Configuring Inputs
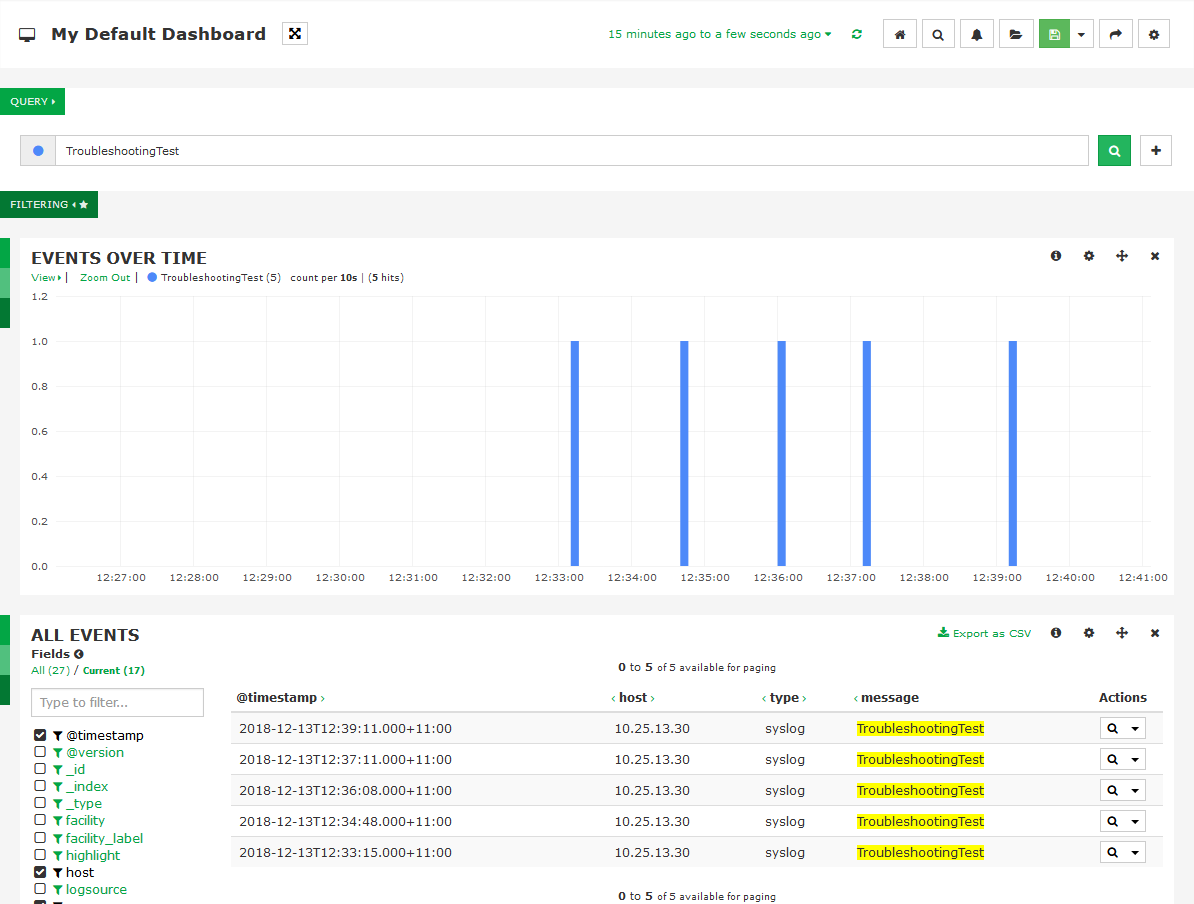
Log Server - Search Log Server Dashboard
To confirm the logs are being received you can search for the logs in the dashboard.
Log into Log Server and click the Dashboards menu.
In the default dashboard we can search for the test logs we generated.
In the Query field type:
TroubleshootingTest
Press Enter and you should see the results below in the "Events Over Time" and "All Events" panels.
Log Server - Check Logstash Log
If you are still not seeing anything in the default dashboard you can check the logstash log file. Normally nothing is logged in here unless something goes wrong.
To check, execute the following command:
tail -f /var/log/logstash/logstash.log
Log Server - Logs Appear A Few Hours Later
It has been observed that you do not see the logs in the default dashboard you until a few hours after they were sent. In some situations the date and time is not correctly set on all the Nagios Log Server nodes.
Follow this article to ensure the cluster timezone settings are correct:
Documentation - Cluster Timezone Settings
Log Server - Disable Filters
An incorrectly typed filter can cause logs to not be processed by Log Server. A useful troubleshooting technique is to disable any extra filters you have added and see if the logs start appearing.
-
Log into Log Server and click the Configure menu.
-
Under Global (All Instances) click Global Config
-
On the right side of the screen is the Filters section.
-
The default filter included in Nagios Log Server is Apache (Default)
-
Disable any other filters you have added by clicking the Active icon (it will turn into Inactive)
-
Click the Save & Apply button at the top
Once you've disabled the filters, go to the Dashboards and see if logs start appearing.
You will need to go through the process of enabling filters one-by-one (Save & Apply) each time until you identify the filter that is causing the issue. Once you know what filter is causing the issue, you can investigate further into why there is an issue with this filter.
Final Thoughts
For any support related questions please visit the Nagios Support Forums at: